|
This is going to be a long and technical one sorry. This month I want to talk about an experiment I've done pretty much every day for the last three months (plus continuously over the last 2.5 years) - Western Blot. Western blots are used to visualise and identify individual proteins. In this technique you have a solution (called a lysate) filled with the majority of proteins from cells. This technique separates these proteins out by size and allows you to stain for specific proteins you want (more on this later). This is the standard way to visualise proteins but it is very subjective and is tricky to perfect (I hope you will appreciate why after reading this). The proteins are visualised by staining them with antibodies specific to that protein and then using a chemical reaction to produce light which can be picked up by a machine. The resulting image is of black bands. The intensity of the black band determines the approximate level of protein present. There are a few steps to Western Blotting which I will go through. The whole technique can take 1-3 days depending on what proteins you are looking for and what you choose to do in each step. Steps to Western Blotting:
A little bit of terminology before we begin:
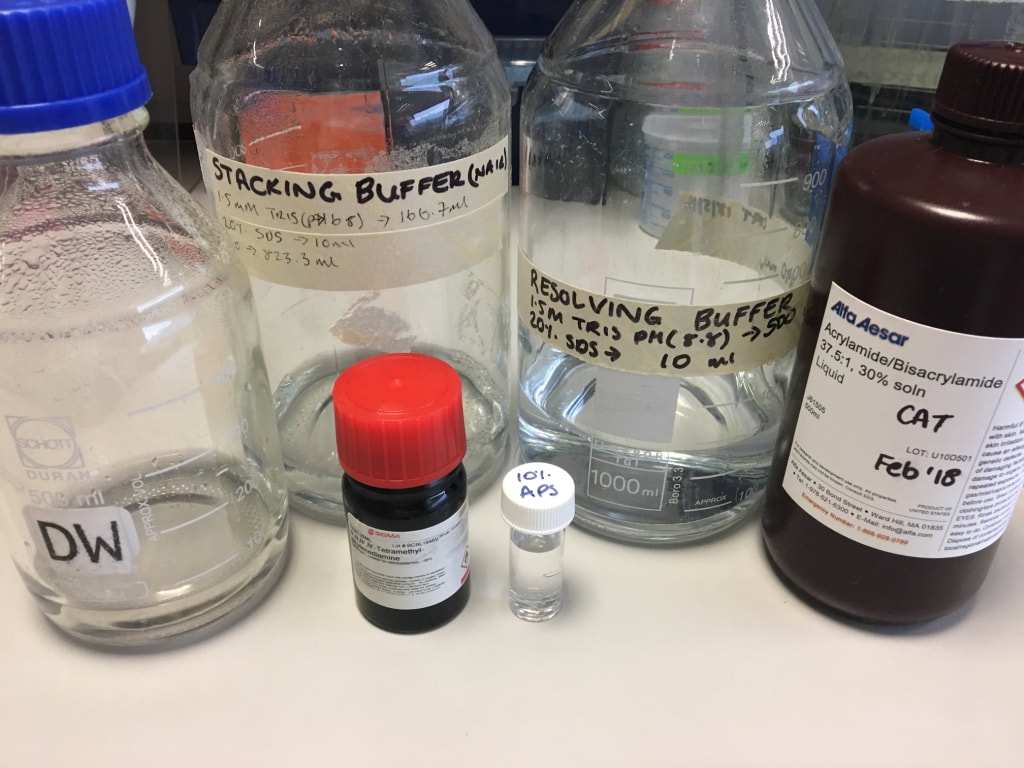
STEP 1: Preparation Reagents and Buffers Before you begin a western you need to make sure you have all your reagents prepared. I will NOT be going through this, all I will say is you need reagents for
Protein Preparation: When you extract your protein from your cells you end up with a protein lysate. This contains the majority of the proteins in your cells. You don't know what the concentration of the total protein is but you are sure that each sample doesn't contain the same concentration. This is due to how well the extraction went in each individual sample but also how many cells there is to extract protein from. There are a few ways of finding out the concentration of your protein which I won't go through (I use the Bradford Assay from BioRad). What you do need to know is that for each sample you need to make up a solution of protein, water and loading buffer to load onto your gel. You can use as much or as little protein as you want, I typically use 10-15ug per well. I load 20ul per well so I need:
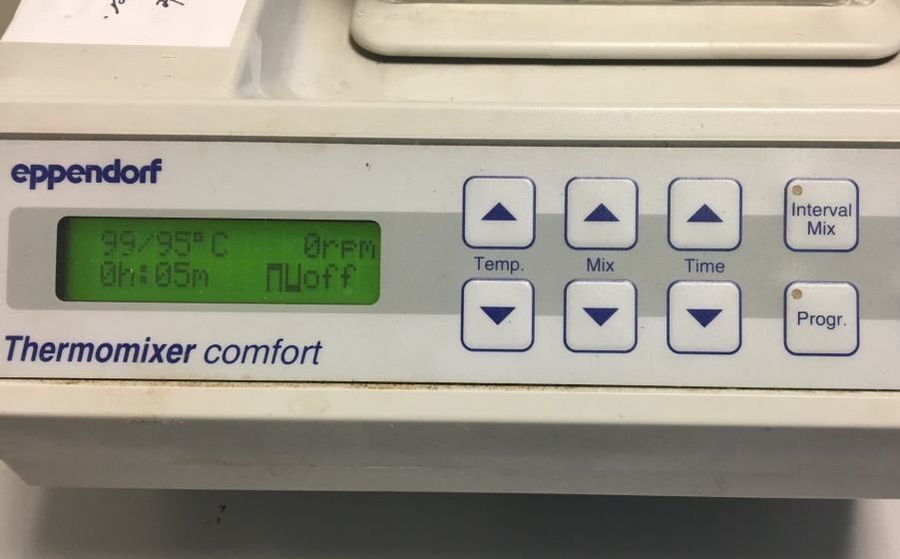
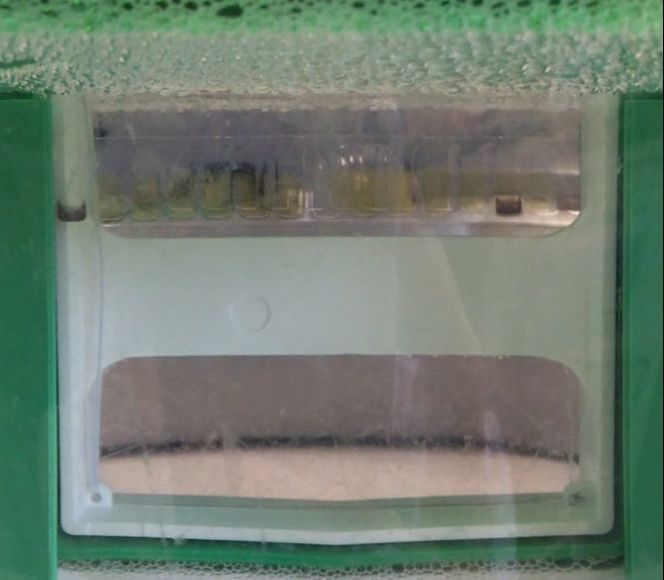
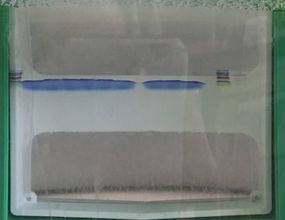
There are many types of loading buffer, I use Laemmli buffer. The loading buffer has a couple of functions. You are using an electric current to make the proteins travel through the gel. Proteins are all different charges so the buffer makes sure all the proteins have the same charge (negative) - this is done by a chemical called SDS. Proteins are globular structures. These don't run though a gel very well so you need to unravel the proteins into single strands (called denaturation). The buffer will start this process - a chemical called β-mercaptoethanol breaks disulphide bonds. The loading buffer also has a dye in it. This is called the "loading front" which runs faster than your proteins. This allows you to track how far your proteins have travelled through the gel (image later). A quick note - usually the protein samples you have prepared will be blue once you add the loading buffer and boil it. This is because the dye in the loading buffer is blue. However, the protein I will show in this post will be yellow. This is because I extracted the proteins using acid and the acid in the lysate turns the buffer yellow. Once the gel starts running the dye front goes back to blue. Gels are made up of:
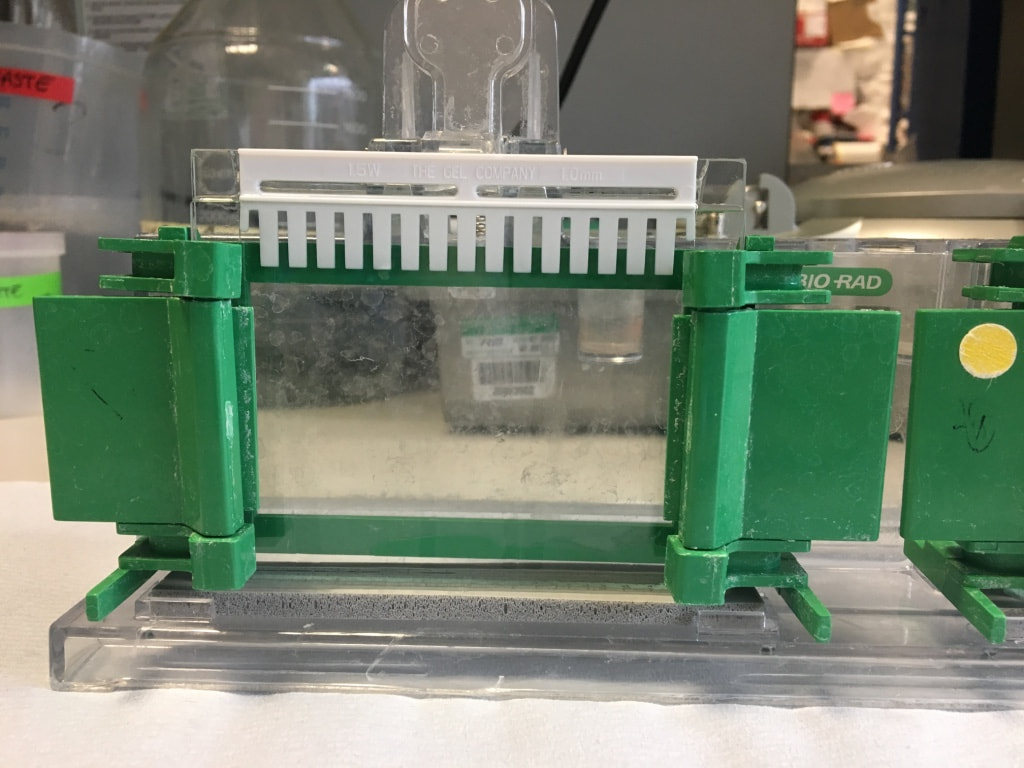
The acrylamide will set into a gel which has pores in it. The protein will travel through these pores. The percentage of acrylamide used determines how big these pores are. Large proteins run slowly through a gel whereas smaller proteins will run very quickly through the gel. A lower percentage gel (e.g. 7%) will have large pores, allowing larger proteins to run faster through the gel. However you are likely to lose all the smallest proteins. A higher percentage gel (e.g. 12.5%) will have very small pores which slow down the small proteins, allowing you to visualise them easier. However all your largest proteins might not run as they can't past through the pores. There are two types of gels used in gel electrophoresis - a stacking gel and a resolving gel. They're pretty much made up of the same ingredients (a stacking gel is slightly more acidic pH 6.8).
Steps to making a gel:
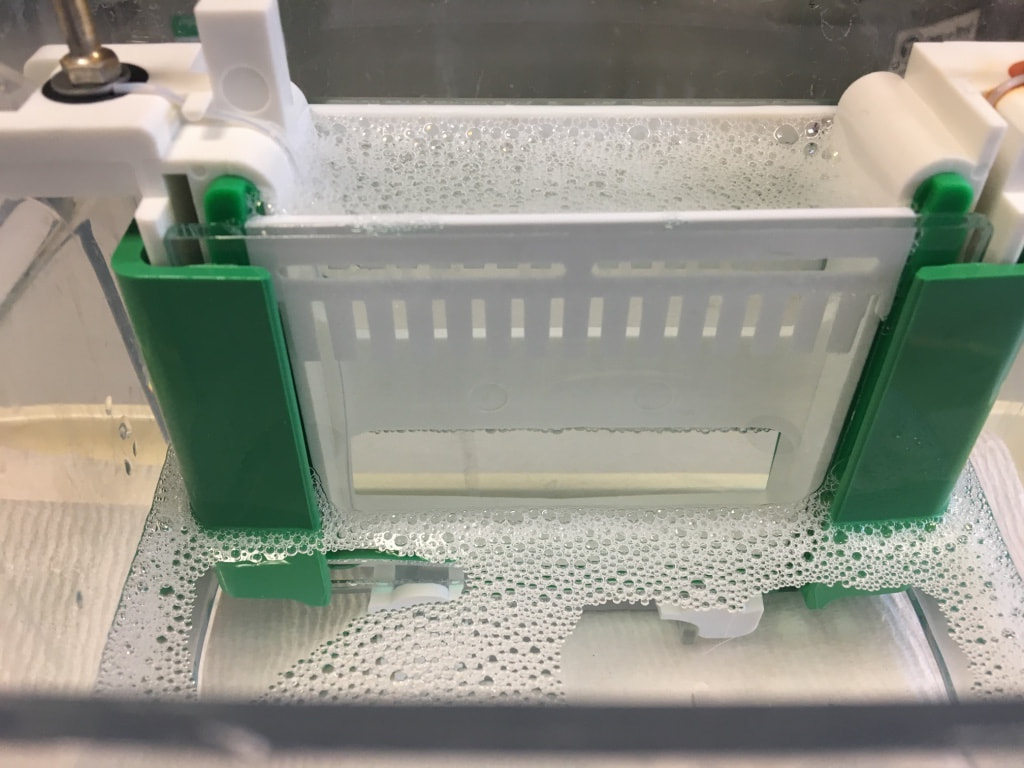
I have made up a 12.5% gel for this example to run histone proteins which are approx 15-17kDa in size. I will also stain for a loading control, beta actin, which is 45kDa in size. STEP 2: Loading and running SDS-PAGE Gel Electrophoresis The next step is to load your prepared protein into the wells in your stacking gel and running an electric current through the gel to allow the proteins to travel from negative to positive. The gel(s) are clamped into an electrode chamber and placed in a running tank. The centre is filled with running buffer. The running buffer allows an efficient flow of electrical current to pass through the gels. It also prevents the gels from drying out which you do not want.
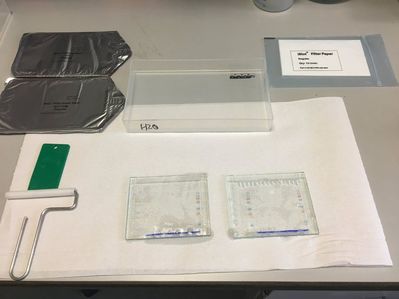
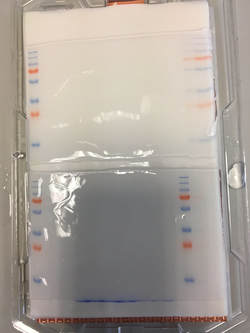
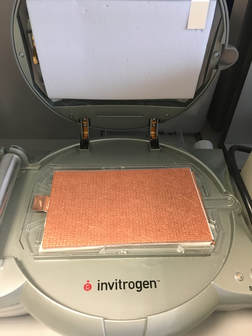
STEP 3: Transferring proteins from gel to PVDF membrane Once the gel has run enough you can stop it. This depends on how long you want to wait for and what proteins you're looking for. My proteins are very small (17kDa) so I can stop my gel once I see the 17kDa ladder band is far enough from the loading front. The next step is to transfer the proteins from the gel onto a membrane. You cannot stain for your proteins on the gel as it is far to delicate and not permeable - the protein only runs through the gel because we created the wells. The membrane is more permeable and allows you to stain for proteins. There are a couple of (messy and time consuming) ways to transfer proteins but I prefer to use the iBlot dry technique. This basically transfers the proteins using a machine in 5 minutes (compared to 1-2 hours). The transfer stack consists of:
Again an electric current is used to push the proteins through the gel into the membrane. However the voltage is very low. As we know, small proteins move very quickly. The low voltage prevents the small proteins from passing straight through the membrane. So how does it work:
After the transfer is complete you need to be VERY fast. You have to quickly remove the stack from the machine, get the membrane out of the stack and place it in TBST. The membrane CANNOT dry out or else all is lost. You can check your transfer at this stage using Ponceau red, which is a red dye that shows up all the wells and bands of proteins but I did not do that today. STEP 4: Blocking The next step is to block any unspecific binding. The antibodies are usually polyclonal - meaning they can bind to other proteins that aren't your protein of interest. To prevent this and also to get a nice clean image at the end, you block unspecific binding. You can block using either of these two reagents:
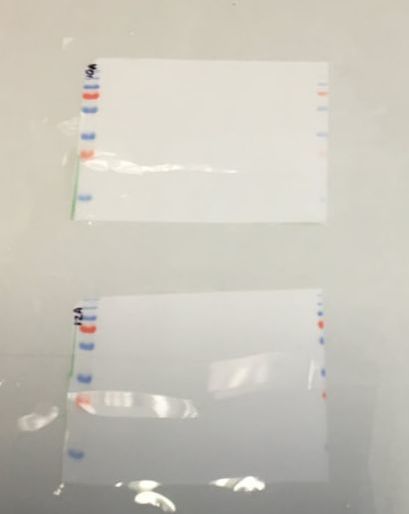
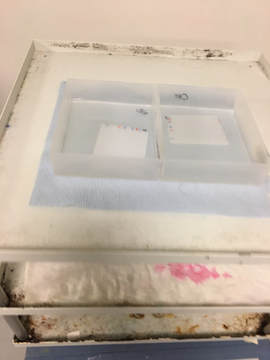
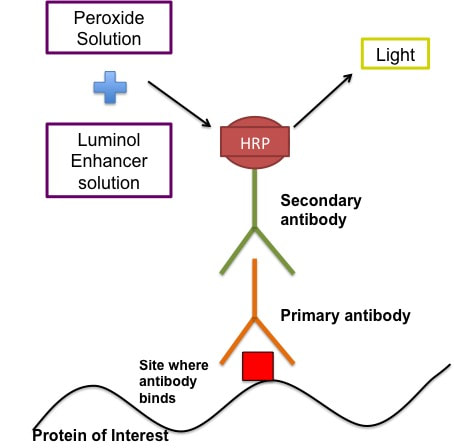
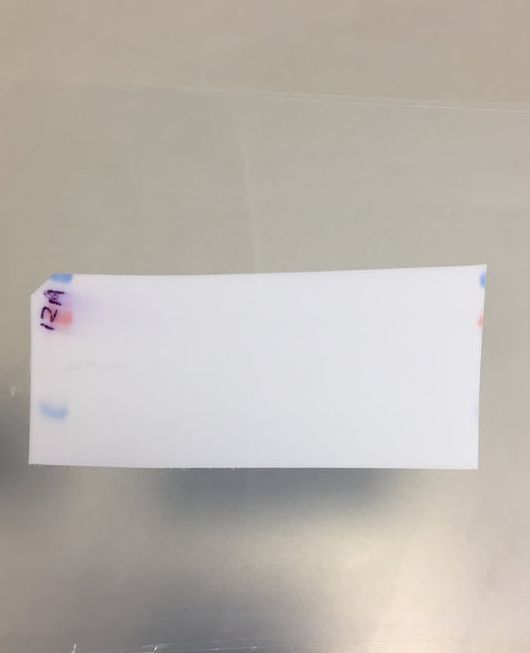
The reagent you are using depends on the antibodies and proteins you are looking for. I block in 5% BSA/TBST/NaN3. Before I block I cut my membrane so that I have the two individual gels again. You don't have to do this but I like to. At this point I just cut the excess off using the ladders as a guide. I then mark with a pen on the ladder what gel it is. The membranes are blocked for 1 hour at room temperature on a rocker. This is now when we can call out membrane a blot. After blocking you can cut your blots to stain for multiple proteins. In this case I cut at 36kDa band (blue band above the bottom red band on the ladder) to stain for my histone proteins and also my beta actin loading control. STEP 5: Antibody Staining of Proteins This technique as I said uses antibodies which bind to specific proteins and you can them visualise these antibodies using a chemical reaction. The figure below gives a rough idea of how the technique works.
The antibodies are created in different animal models (please don't ask how cause I have no idea). So if your primary antibody is developed in a rabbit then the secondary antibody will be goat anti-rabbit (i.e an antibody developed in a goat to bind specifically to rabbit-developed antibodies). There are some human antibodies but they're incredibly expensive. The primary antibodies are made up in the buffer recommended by the manufacturer usually 5% BSA/TBST/NaN3. The recommended concentration is usually given by the manufacturer - typically 1:1000 or 1:2000 (i.e. 1ul antibody in 1ml solvent). The secondary antibodies are made up in usually either 5% BSA/TBST or 5% Milk/TBST. The BSA doesn't contain NaN3 in the secondary because sodium azide (NaN3) inhibits the secondary antibody. The concentration of the secondary depends on how abundant the protein is and how long you develop it for. For example beta actin, which makes up part of the cytoskeleton of your cells, is an incredibly abundant protein so the secondary concentration is 1:50,000 BUT another protein I look at p-AMPK is not so abundant and the secondary concentration could be as low as 1:1000. Part 1: Primary antibody incubation and washing
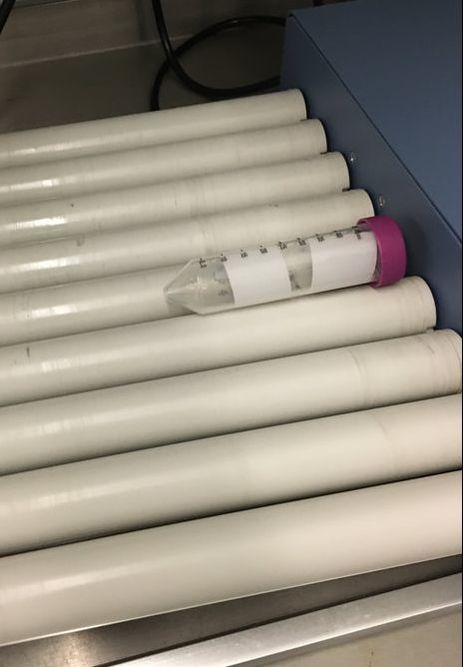
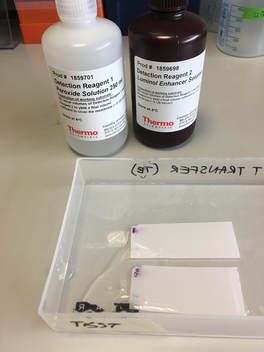
NOTE: for beta actin, you do a 1 hour incubation at room temperature Part 2: Secondary antibody incubation and washing For the secondary antibody you can do this at room temperature for 30 minutes - 1 hour, again on a roller. I make up most of my secondaries in 5% Milk/TBST, except p-AMPK. The casein in the milk removes phosphorylation from proteins so I would lose my p from the p-AMPK if I did the secondary in milk. So for p-AMPK and all phosphorylation proteins I use 5% BSA/TBST. Again after incubation in the secondary, the blot(s) need to be washed at least 6x5 minutes to remove excess secondary antibody. The washing part of the procedure is honestly the most time consuming and tedious. It's a lot of back and forth to and from my office desk to the rocker. I usually try to do something else in the lab to not waste the time but sometimes it can't be avoided. STEP 6: Developing The final step (thank god) is to develop your blot. This step adds the peroxide and luminol enhancer solutions (collectively known as ECL solutions) to the membranes. You then take the membranes to a chemiluminescence machine which will detect the light emitted and give you an image in return. Steps:
You end up with a picture which has black bands. As I said at the start the intensity of the bands indicates how much protein is present - very dark means a lot, very light means very little and nothing means nothing. The image above shows the loading control (beta actin) for a blot I have done for two cell lines, MCF10A (lane 1-3) and MCF12A (lane 4-6). The bands are very dark indicating that the protein is very abundant. What's important is the bands are almost the exact same size and intensity as each other (different in the two cell lines) indicating that my loading was very even (wahey). Once the blot is developed you can keep it or you can throw it away. If you keep it and want to stain for another protein or the same protein but with a different secondary concentration you need to strip the blot (i.e. remove all antibodies bound to proteins), re-block using the same blocking buffer and re-incubate with the primary and secondary antibodies. A blot should only really be stripped twice. This will add another day onto your experiment (at least). And that is it. That is roughly how a western blot works. The reason why western blots are THE most hated laboratory experiment is because they rarely go the way you want them to, there is always a difference each time you do it and it takes FOREVER. If a western goes wrong most of the time you have no idea why. It can be anything from one specific buffer which was made up wrong to the wrong gel percentage, the wrong transfer time or transfer voltage etc. Basically everything you did could have an issue associated with it. Trust me I did troubleshooting for TWO MONTHS on one antibody. It eats away at your soul. Western blotting everyone.
1 Comment
It's the last and final day of our cell viability assay. Today we will measure how much crystal violet there is in each well and analyse our data.
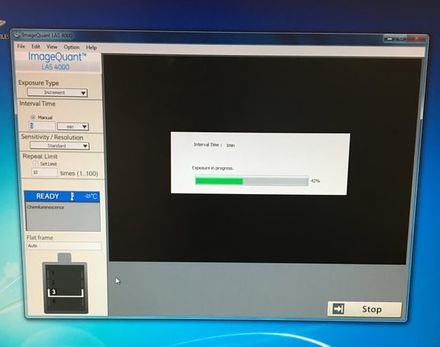
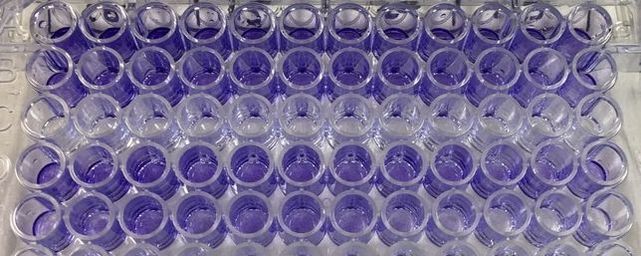
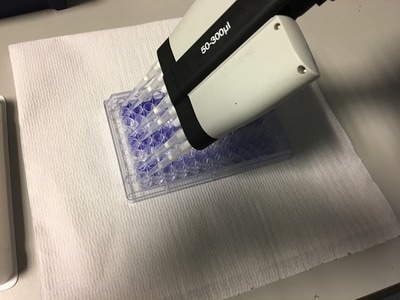
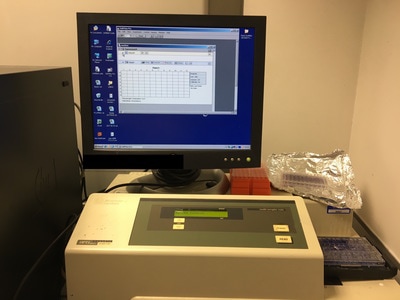
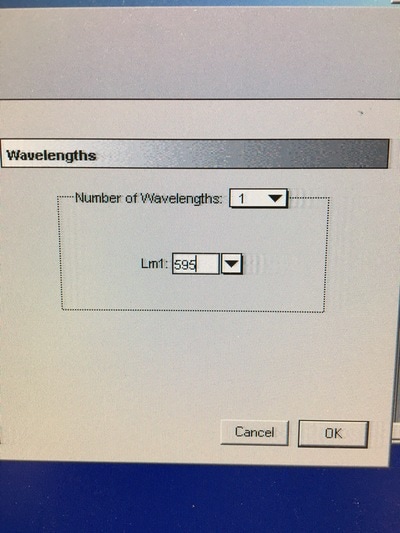
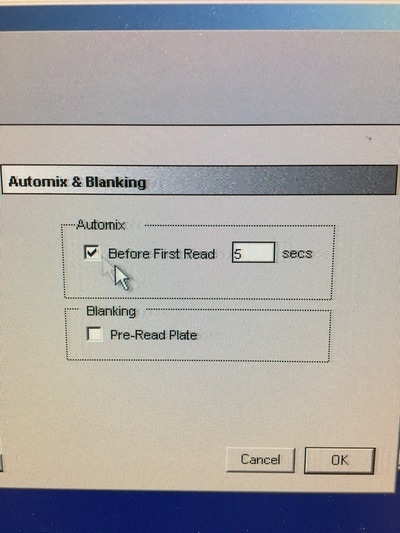
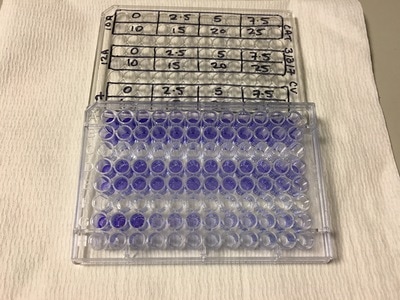
Part 1: Measuring Crystal Violet Absorbance To understand the next part I need to talk to you about absorbance. When light hits an object a certain amount of light bounces back which we see. For example white doesn't absorb light and bounces back almost all the light whereas black absorbs light and bounces back almost no light. The colours we see are different levels of light bouncing back from an object which is picked up by our eyes. Each colour has a different wavelength. The absorbance reader uses this principle. The reader (in picture 4) sends light into each well of the plate. It then measures how much light is absorbed. The higher the absorbance, the less light bounces back or the more light is absorbed by the object. We tell the machine what wavelength crystal violet is on, in this case it's 595nm. But the crystal violet we have is dried into the attached cells. We can't measure absorbance this way as the absorbance reader needs a liquid. So we dissolve the crystal violet in 10% acetic acid (which is essentially vinegar). The vinegar draws the crystal violet from the cells, allowing it to dissolve in the liquid. We add 80ul of 10% acetic acid to each well. This MUST be exact. The absorbance reader uses light absorbance and the volume of liquid to make its measurement. If the liquid is different in each well, the absorbance measurement will also be different. As shown in pictures 1-3, the 10% acetic acid is added to each well and placed on a rocker for at least 20 minutes. This aids in drawing out the crystal violet dye from the cells. We also add 80ul of 10% acetic acid to three wells with no cells in them. This is our blank. The plate itself and the acetic acid will have a small absorbance. We call this "background". We want to remove the background to make sure the data we use is completely from the the cells attached to the wells. We then place the plate into the absorbance reader machine and set the wavelength to 595nm. To make doubly sure that all the crystal violet is dissolved into the 10% acetic acid we set the machine to automix for 5 seconds before reading the plate. The machine essentially gently shakes the plate (picture 6).
Part 2: Analysing the Data
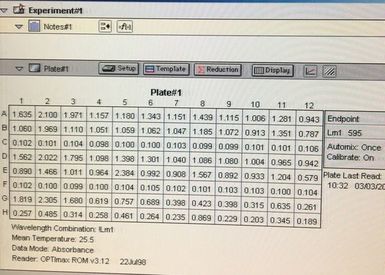
Once the machine has read the absorbance of the plate it gives you a read out (for example picture 7. I will point out this is an old picture and not our results).
We can then export this to excel (picture 8). I have highlighted the wells for each cell line and also each dose. As you can see the white wells are the absorbance given by the plate. The first three wells on line 3 are our blanks.
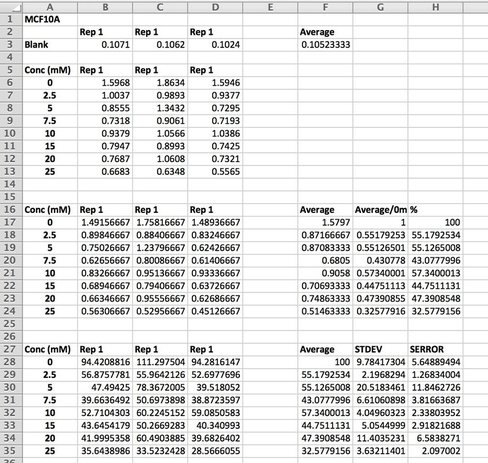
We then want to analyse our data (picture 9).
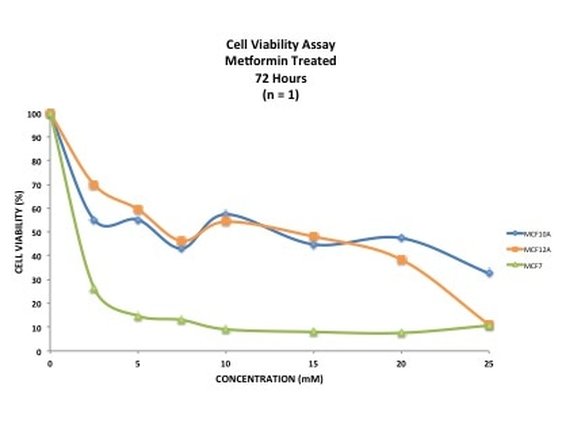
We take an average of our blank as well as our data. As I said in Day 1, we do everything in triplicate (called a biological triplicate). This allows us to average over the three wells and should even out discrepancies between wells. These discrepancies can be caused by technical error (e.g. treating or adding the 10% acetic acid) or by the equipment (e.g. the pipette etc.). Before we average our data, we take the average of the blank from each well (see B17 - D24). We then average our data and make this into a percentage. We then calculate the standard deviation and standard error. This tells us how close our triplicates are to each other. The higher the STDEV and SERROR, the more differences there are between triplicates. This give us our error bars. As we have only done one experiment, there are no error bars but once you do three or more and average across experiments you can then add the error bars. We then plot the results on a smooth scatter plot (picture 10).
Picture 10 finally shows the results of our experiment. As you can see, we have not gotten what we expect. A typical assay like this where we know the drug kills cells should have a smooth line which decreases or doesn't change as you move across doses. This is evident in MCF7 (green line) however it is not perfect, as it starts to increase at the highest dose. In our two non-cancerous cell lines MCF10A (blue) and MCF12A (orange), there is a lot of up and down. This shouldn't look like this. How I know is by looking at the triplicates for these two cell lines and the standard error. You can see that in some cases (picture 9), all the triplicates are similar however in others, there is one triplicate which is higher than the rest by a significant amount. For example in picture 9, row 20B, the second triplicate for 7.5mM is much higher than the other two. This will throw off the average, making it higher then it may actually be. The standard error is also very high in some concentrations, making me think that technical error is putting the results off.
There are a number of reasons why this could happen:
This demonstrates that 1) your experiment will always go wrong at least once, especially when you first do it and 2) how important it is to repeat your experiments at least three times (called a technical replicate). These results could be due to technical fault or they could be real. By running the experiment three (or sometimes more) times you eliminate one of those possibilities, leaving the other. Once we have our final data we can work out the IC50 - this is the concentration of drug needed to kill or reduce viability of 50% of the cells. It is a good indicator as to how much drug you want to use. If you want (like me) to induce an effect from drug treatment but not kill off all the cells then you use a concentration lower than the IC50. However if your aim is to decimate the cells then you would use concentrations above the IC50. Unfortunately the data is a bit haphazard to get an accurate IC50 from. And that's it. This experiment will need to be done a few more times to see if it's technical error or if the cells really do this. I will post up the results of those experiments when I have them and hopefully we shall see something interesting. I will also show you how to calculate an IC50. I really hope that you have enjoyed doing this experiment with me and now have a little bit of an idea about what goes into an experiment like this. If you have any questions or comments please don't hesitate to comment below or send me a message on the FAQ page.
It's day 6 and our cells have been living in our drug Metformin for 3 days. Today we will start Part 1 of 2 of our Crystal Violet Experiment.
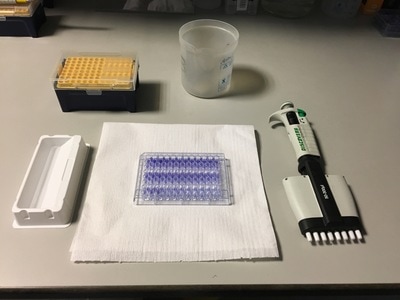
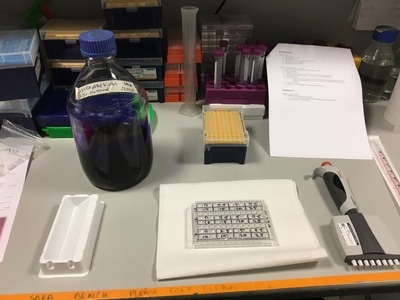
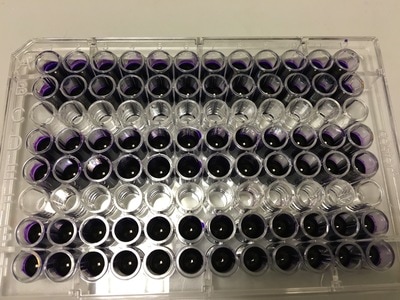
To re-cap: Crystal violet ONLY stains cells that are attached to a culture plate by dyes proteins and DNA within the attached cells. So we want to stain our cells and see how many are "alive" or left on the plate. Part 1: Staining with Crystal Violet First off I want to apologise for the lack of images. Crystal violet is messy and I can only take pictures when I'm not wearing a lab glove. So I choose safety over pretty pictures (Nahal would be proud). The first step with any experiment (as I've shown before) is preparation. I like to get all my reagents, pipette tips etc. ready before I start (as seen in picture 1). The next step is to get rid off the media from the plates into a sink. We then wash the well (like we did when making our cell suspension) with PBS twice, about 200ul. The PBS is removed each time into the sink (by a highly scientific technique of dumping it out in a chucking motion). 80ul of crystal violet is added into each well (picture 2) and left on a rocker for at least 20 minutes. This spreads the dye evenly around the wells and makes sure the cells that are attached take up the dye.
Part 2: Removing the Crystal Violet
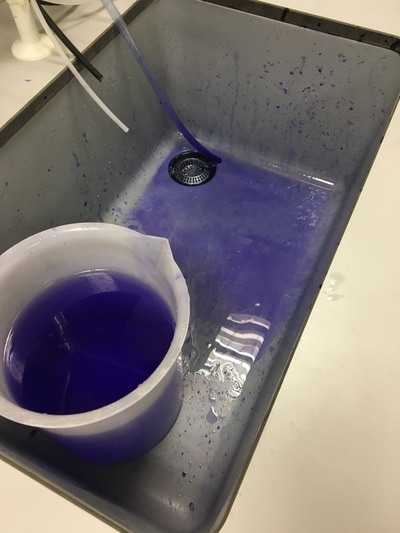
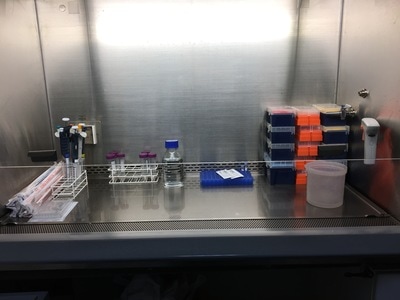
THIS is when it gets messy. This dye stains everything and is difficult to wash off so we first get as much of it out of the well as possible into a specific container in the fume hood (picture 3). We then wash off the excess. We have some very technical equipment here: a bucket and a sink (picture 4). We fill the bucket with cold water and dump the plate into the water. This fills the wells with water and then we chuck it into the sink. You can understand why this gets messy and turns the sink purple (a little ethanol gets that right off). You keep doing this until the water coming out of the plate is clear. This means all the excess is removed and the purple that is left is only absorbed by attached cells.
Part 3: Drying the Plate
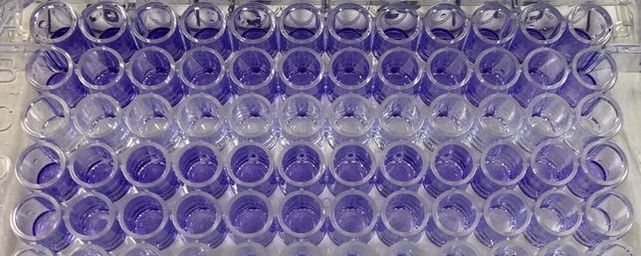
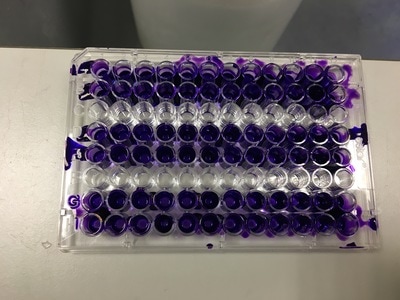
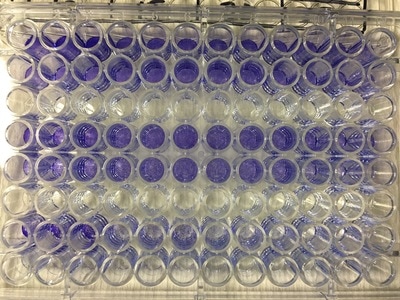
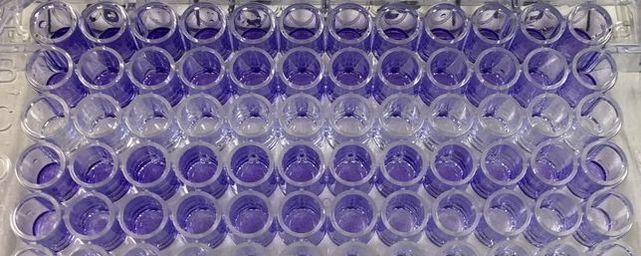
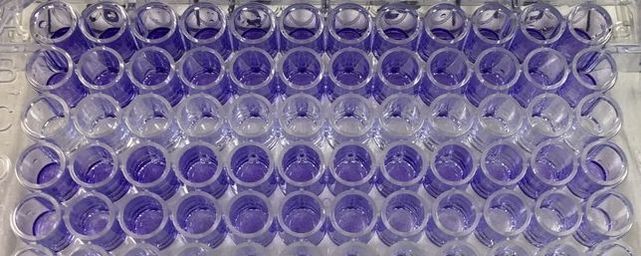
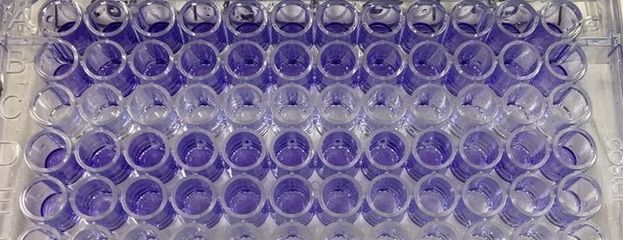
It's important to let the plate dry for a few hours or preferably overnight. This allows any water to evaporate. We will be measuring how much crystal violet is in each well tomorrow and we don't want the water to mess up our results. As you can hopefully see in picture 5 and 6, some of the wells have a lot of purple dye and some have barely any.
And that's it for today. I know it is very slow but this really is what science is. When you do experiments the majority of the time you do a little bit one day, a little bit another and you end up waiting for hours and hours for something to happen. Which is why it can be so frustrating when it goes wrong. This simple experiment takes 7 days to complete, imagine the time spent doing more complicated experiments.
So that's it for today. Come back tomorrow to finish the last part of our experiment. We will read the absorbance (I will explain tomorrow) of our crystal violet staining and then analyse our data.
It's Day 3 and today we will be treating our cells with the drug Metformin.
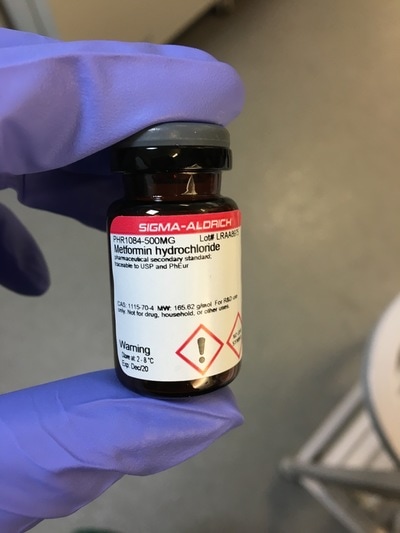
Just a bit of background on Metformin. Metformin is a Type II Diabetes Mellitus (T2DM) drug that has been used since the 1950s. It is the most commonly prescribed T2DM drug meaning most people who have T2DM will have been prescribed Metformin at some point during the course of their disease. We know that Metformin targets mitochondria. Mitochondria are the batteries in your cell where the energy to run your cell is made. You can have hundreds and hundreds of mitochondria all working to keep the cell ticking along. Interestingly, all your mitochondria come from your mother. In T2DM you develop insulin resistance. Basically insulin (a hormone made in your pancreas) tells cells to take up glucose from the blood after eating. But T2DM patients make their OWN glucose and don't need to listen to insulin. Your pancreas finds this confusing so churns out more and more insulin, thinking "they'll listen to this!" Eventually your pancreas gives up and you have all this unused glucose floating around in your blood. What Metformin does is it stops your cells from making its own glucose. This forces the cells to listen to insulin and start taking up glucose from the blood. But Metformin also interacts with a whole HEAP of other pathways in cancer alone (some of which are in picture 1) and no one knows why or exactly how. Which is where I come in (in part)! 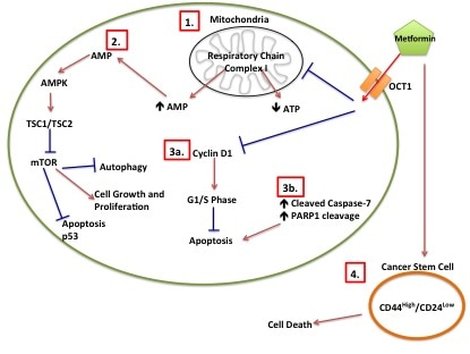
Picture 1: Metformin Proposed Mechanisms of Action in Cancer. (1) Metformin inhibits mitochondrial respiratory chain I which leads to decreased ATP and increased AMP. (2) Increased AMP leads to increased AMPK, which inhibits mTOR. (3a) Metformin inhibits Cyclin D1, which prevents cells from going into G1/S phase. (3b) Induction of apoptotic intermediates such as cleavage of Caspase-7 and cleavage of PARP1 leads to apoptosis. (4) Metformin induces cancer stem cell death.
So now we know what our drug does, on to the treating.
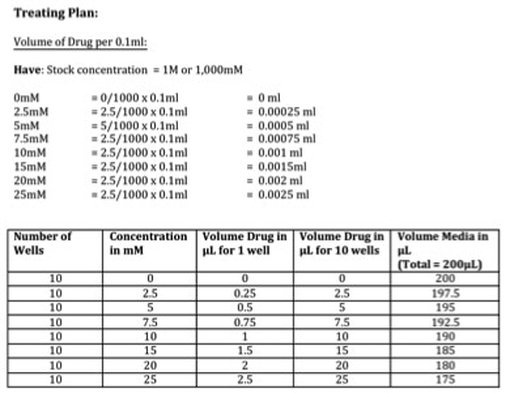
Part 1: Planing the treatment So before we start with the treating we need to know how much we are treating with in mM and convert this to a volume. I've done this part as a picture (picture 2) as it's easier to explain. We have our stock concentration of Metformin which is 1M or 1,000mM. We want to have a gradient of 7 concentrations (see picture) so we need to work out what volume of drug we need to have that concentration in each well. We then scale this up to however many wells we need (in our case it's 10). The calculation is: (WANT/HAVE) x FINAL VOLUME This gives you the answer in ml. We want ul so you multiply by 100 to get the volume of drug for 1 well in ul (see table). We want to do this for 10 wells so we multiple the volume of drug again by 10 giving up the volume of drug in ul for 10 wells (see table). We then need to calculate how much media we require to dissolve our drug into. Because we don't want to disturb the cells at this point, we don't remove all 0.1ml of media. We instead remove a 5th of the media (or 20ul) per well. So you multiply 20ul by the number of wells you want to treat giving you 200ul total. We then take the volume of drug away from the total volume of media (like with our plating) leaving you with the volume of media in ul for 10 wells (see table). The cells will still receive the same amount of drug in each well don't worry.
Part 2: Treating Our Cells
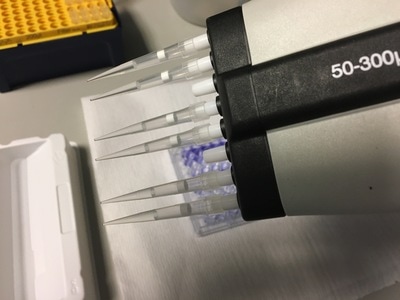
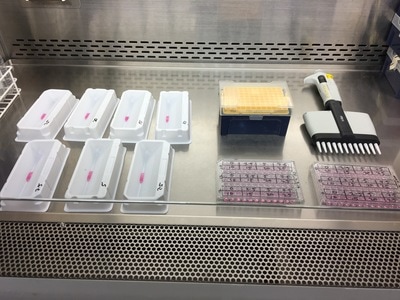
Once we've calculated all of the above we then make this up in labelled 1.5ml eppendorf tubes. Again we will use a multichannel pipette to treat the cells (due to the wrist injury) so we transfer our drug + media into labelled reservoirs (see picture 4 - picture from earlier experiment apologies). We add the appropriate drug to the appropriate wells (e.g. 2.5mM to the three 2.5mM wells) and leave in an incubator at 37°C and 5% CO2 for 72 hours or three days. The cells don't need to be retreated because this a short time course experiment.
And there you have it! We have now plated and treated our cells with our drug. We now wait three days to allow the drug to do its thing.
Come back on Tuesday 7th March to see how we do the next (and messiest) stage of our experiment: Crystal Violet!
So to recap from yesterday...we planned our cell viability assay to test whether the Type II Diabetes drug Metformin can reduce cell viability of three cell lines - MCF10A, MCF12A and MCF7.
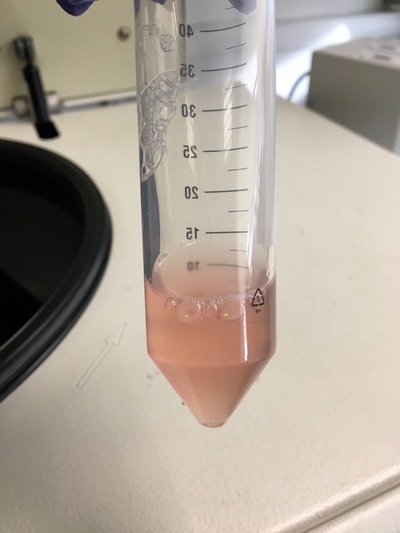
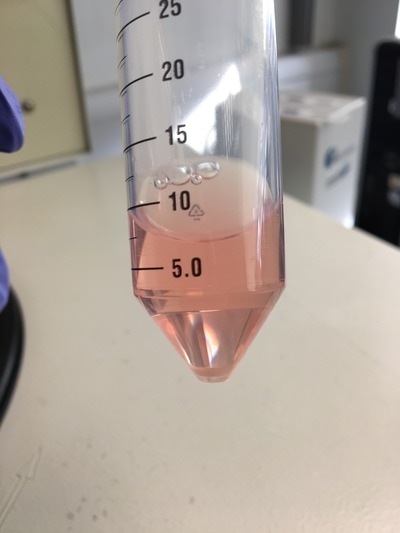
Today! We will start our experiment but plating our cells into the 96-well plate to treat. Day 2: Plating Our Experiment It's important to remember our information we had yesterday (reagents, equipment, plate plan). Part 1: Making A Cell Suspension As I've explained before the cell lines are grown in a flask and attach to the plastic. But we want them to detach to be able to plate them up (don't worry the majority will survive not detached for a short time). This is called a cell suspension. We create a cell suspension by first removing the media. This gets rid of all the dead cells. The media also inhibits the reagent we'll use to detach the cells so we need to get rid of it. Once the media is removed we wash the flask with PBS to make sure that there is NO media left. PBS (or phosphate buffered saline to those interested) is a clear liquid that does not react with other liquids or cells and is often used for washing cells etc. (like soap but less harsh - also we don't use soap on cells...). Once the cells are nice and clean we add EDTA/Trypsin. Basically these chemicals together "scrape" the cells off the bottom of the flask (for more in depth explanation see yesterday's post). Depending on the cell line you use this can take 2 minutes (MCF7) or 15 minutes (MCF10A and MCF12A). After you leave it for it's needed time all the cells detach off the plate, leaving you with a cloudy liquid chock-full of cells (see picture 2). BUT EDTA/Trypsin is toxic to cells and will eventually kill them so you need to neutralize it. Remember when I talked about media and what it does to EDTA/Trypsin? You got it. We add media to the cell suspension to neutralize the EDTA/Trypsin. We then put the cell suspension in a 50ml falcon (see picture 3). As you can see it's all cloudy because of all the cells floating around. We could use these cells however there is a chance that not all of the EDTA/Trypsin is neutralized so we want to get rid of the liquid and replace it with new liquid while keeping our cells. We do this by first centrifuging the cells at a very low speed. The centrifuge will force all of the cells to fall to the bottom of the flask because they are "heavier" than the liquid (see picture 4). We can then take off the liquid while leaving the cells intact and add new media (free of toxins). This puts the cells back to floating around (like picture 3) and there we have our cell suspension.
Part 2: Counting Our Cells
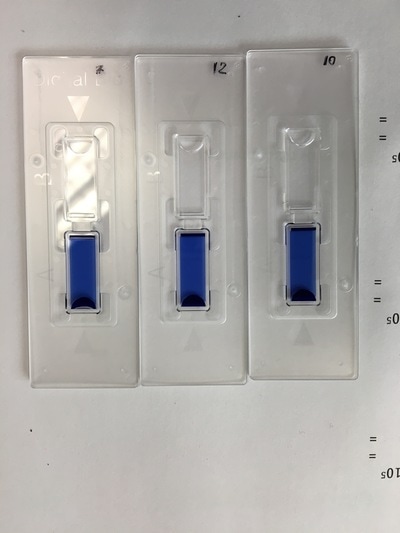
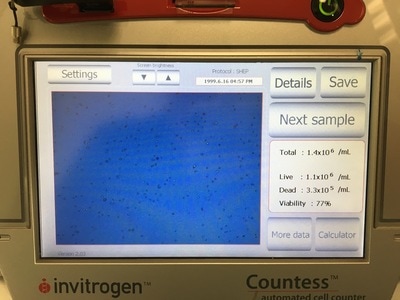
It is important in an experiment to have a similar number of cells in each cell line at the END of the experiment so we can make comparisons. As I said before, these cell lines all grow at a similar pace so plating the same number of cells should give us roughly the same number of cells at the end of our experiment. Now we're hypothesising that Metformin will "kill" some of these cells but it may do this better in some cell lines compared to others. So how do you know you have the same amount of cells at the end? We add a control. The control is 0mM on our plan. This basically has no drug added to it, meaning they should grow without dying (too much) and will represent the total number of cells alive (or 100% alive cells). So on to counting. Cells are counted by adding a blue dye (not crystal violet) but another dye, Trypan Blue. Trypan blue ONLY stains cells that are dead. So we can distinguish between alive (white) and dead cells (blue). Now you can do this manually under a microscope OR you can do it the way I do it which is with a machine! The machine measures how much blue and how much white there is an calculates how many alive cells there are in 1ml of your cell suspension. To do this we take 20ul (which is microlitres or 0.002ml) of trypan blue and add it to 20ul of cell suspension. We then put it in a little cartridge (picture 5) and place it into the machine. The machine then counts the cells and tells us how many we have (picture 6 - total). It tells you how many cells are dead, how many are alive and how good your sample is (viability %). I use the total value because I find that when I use the "Live" value my plates are always over confluent at the end of the experiment (i.e. there's too many cells and not enough space so the cells start to die). But that's me. When I use the "Total" value the controls all have very similar cell numbers at the end so I'm happy with that.
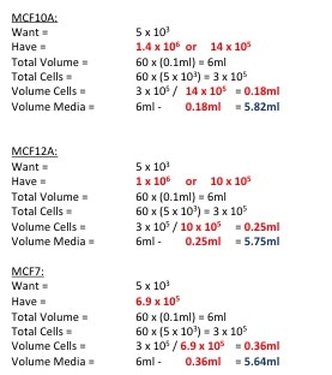
Now to calculate how much cell suspension we need and how much media we need (picture 7). First we convert our "Have" value to the same number are our "Want" value (i.e. make sure the "Have" value is x105). In the case of MCF7 we don't need to do that but for MCF10A and MCF12A we do. So we take one 10 away from x106 and multiply the number before the x by 10. We then divide WANT/HAVE. This gives a value in ml telling us how much cell suspension we need (Value in RED). We then take that away from the "Total Volume" to get how much media we need (value in BLUE).
Part 4: Plating Our Experiment (YAY)
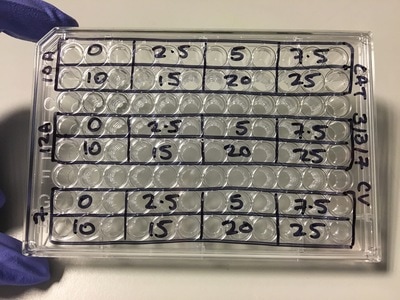
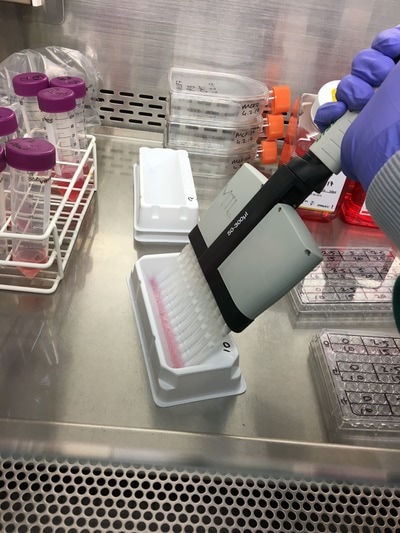
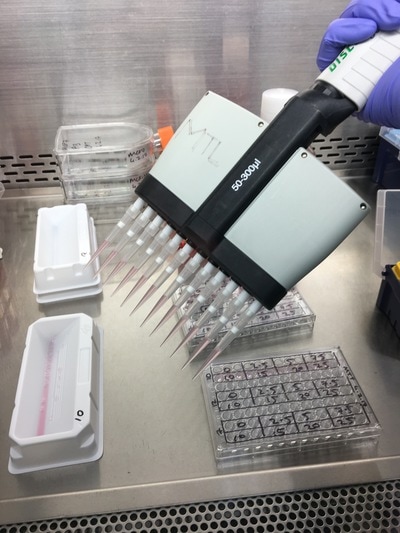
We now have everything we need to plate. We have our plating plan and we have the volumes of cell suspension and media. The final thing we do before we start is draw our plate plan onto the lid of our plate just so we don't forget which well is which. We also label the cell lines and add our name, date and experiment (picture 8). To plate our cells we add the final volume of media to the final volume of cell suspension in a labelled 50ml falcon. We next use a multichannel pipette to add the cells to the plate (see pictures 9 and 10). This is for three reasons: (1) this ensures equal distribution of cells, (2) it's faster then doing each well individually and (3) I have a wrist injury so using a multichannel pipette makes life easier. The multichannel takes up 0.1ml of cell suspension from a reservoir into each pipette tip and adds it evenly to each well. Once all the wells you want to be plated are full of your chosen cell line you then leave the plate in an incubator at 37°C and 5% CO2 overnight.
And that's it! We have now plated our experiment!!!
Tomorrow we will be treating our cells! So exciting!! NOTE: Apologies for the late posting, I was at a conference today and had no time to write this up.
I am trying a little experiment today. I am aiming to take you as a reader through an actual experiment as I do it. This means taking you through day by day from planning to analysing the data. Hopefully it will give you an idea about (1) how an experiment is run and (2) what you do when it goes wrong.
Before I start I want to introduce our experimental models. I have three cell lines that we will experiment on:
DAY 1: Planning
It is important before starting any experiment that you plan what you intend to do. This involves finding out about your experiment (what it is, why you do it, what it does). You then need to work out what reagents and equipment you'll use, how many cells you will need and the timings of plating, treating and completing the experiment. Part 1: Crystal Violet Cell Viability Assay Crystal violet is a common stain used to see the effects of treatments on cell viability (i.e how many cells does the treatment kill over a certain period of time). In 2D culture, cells that are alive tend to attach to the culture plate. When the cell dies it detaches from the plate and floats in the media. Crystal violet ONLY stains cells that are attached to a culture plate by dyes proteins and DNA within the attached cells. The amount of crystal violet can then be measured and this is used as an indirect way of quantifying cell death/viability. Part 2: Equipment and Reagents Buffers/Reagents:
Equipment:
Part 3: Number of Cells and Timing To determine how many cells you need for your experiment you need three pieces of information: (1) the doubling time of your cell line (i.e the time it takes for the amount of cells in your flask to double), (2) the time point you wish to investigate and (3) the size of your experimental plate. For this experiment:
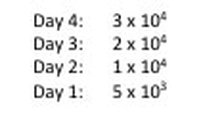
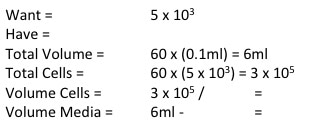
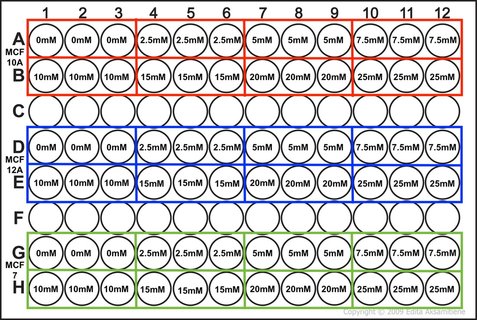
NOTE: weebly doesn't allow me to superscript so whenever you see this "104" please note that is means "10 to the power of 4 or 40,000" I know that when my 96-well plate is full there is theoretically 4 x 10⁴ cells. You then use this as your final time point and half the number of cells until you reach your start time (see picture 1). As my cells aren't all doubling at exactly 24 hours, I reduce my end confluency a little to account for this. You can then work out how much media you need (each well takes 0.1ml) and how many cells you need (see picture 2). I will be doing two rows (12 wells in each row) for each cell line (see picture 3) and I will do two plates (I'm doing a similar but different experiment at the same time which I will explain later). So the total number of wells is 48, rounded up to 60 in case of error. Picture 3 shows the plate plan. Experiments are always run in triplicate (sometimes more). This is so we can average the results and reduce technical error (i.e. error by me). We will be treating our cells with increasing concentrations of our drug Metformin, shown on the plan.
Part 4: Our hypothesis
It is important to have a hypothesis before we begin. This is a question we are asking which we hope our experiment will answer (either positively or negatively). Hypothesis: Metformin reduces cell viability of MCF10A, MCF12A and MCF7 cell lines. So that's it. Tomorrow we will set up our experiment and I will show you how we finish our calculation from picture 2.
Cell Culture, also known as tissue culture or TC, is where the majority of experiments start. A lot of cancer research depends on what we call “models”. The drugs, therapies, interventions etc. we test can be very harmful to humans. It’s also very difficult to watch cancer progression in someone already suffering. You use models such as “cell models” and “animal models” to mimic the human body. It’s not always perfect, but it’s better than giving a highly toxic drug to someone on a hunch it might work. The first stage of model testing is "cell modelling". If the results are promising, you move on to "animal models" or if there is good indication of the safety it may move straight to humans.
What are “Cell Models”? Cell models are cells from tumours which are grown indefinitely outside of the body and are experimented on. “Cell line” is the name given to these cells. Cell lines come from actual people. The most famous is the HeLa cell line, which came from an African-America woman, Henrietta Lacks, with cervical cancer in the 1950’s and 1960’s (for more information you can read the book “The Immortal Lives of Henrietta Lacks” by Rebecca Skloot, which is very good - not sponsored just enjoyed the book). Cancer has a very unique characteristic which makes it hell to get rid of. Cancer cells are immortal. Like a vampire (though not as sensitive to sunlight) cancer cells cannot die. They will continue to grow and multiply as long as there is a steady blood supply (very like vampires so). Why blood? Blood carries food and oxygen all around your body and removes all the bad stuff from your organs such as toxins and carbon dioxide. But back to cell lines. When a tumour is taken from the body you can isolate individual cells. You grow them and if they keep growing they’re known as a cell line. The vast majority of cells from tumours from a person cannot make a cell line. It’s like a lottery to which will survive. Cell lines are named after the person they come from (like Henrietta Lacks) or from the institution they were isolated in. The most common breast cancer cell line is MCF7. MCF stands for the institute where it was “made” – The Michigan Cancer Foundation. 7 stands for the 7th attempt (the successful attempt) to “make” the cell line. The cells were from the mammary tumour of 69-yr old Frances Mallon, a nun in the convent of the Immaculate Heart of Mary in Michigan. This cell line is a model for oestrogen receptor (ER) positive breast cancer. ER+ is one of the most common mutations in certain breast cancers.
What are 2D and 3D “Cell Models”?
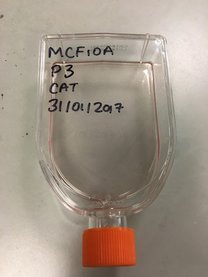
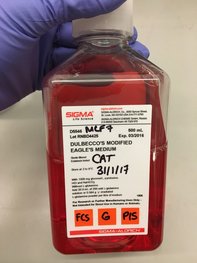
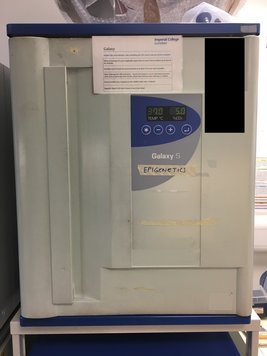
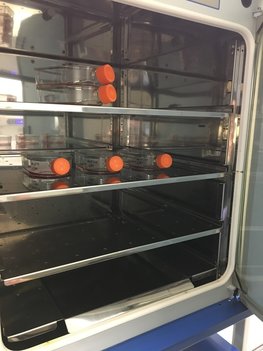
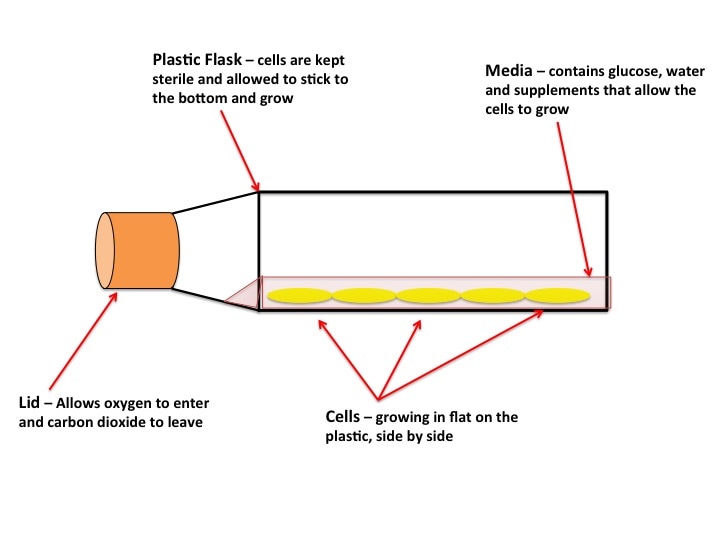
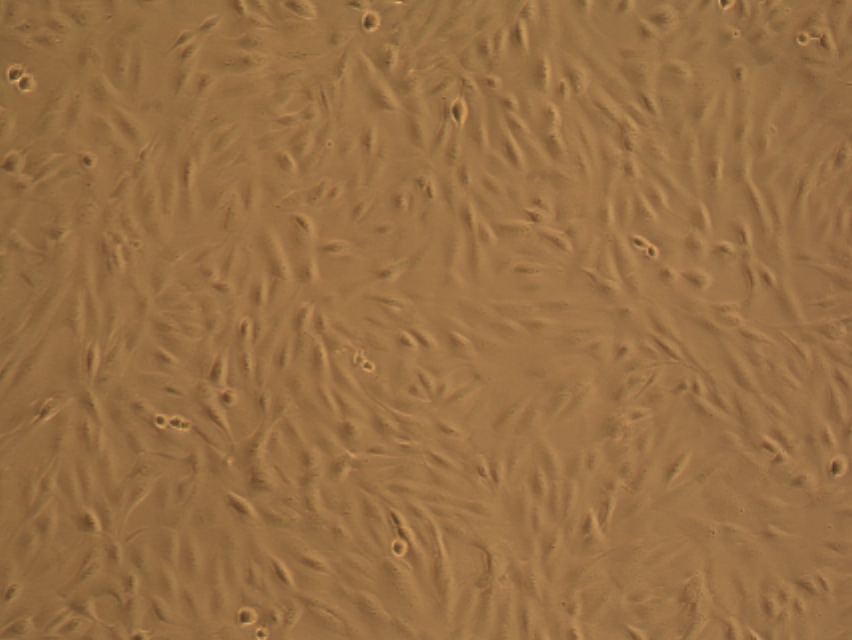
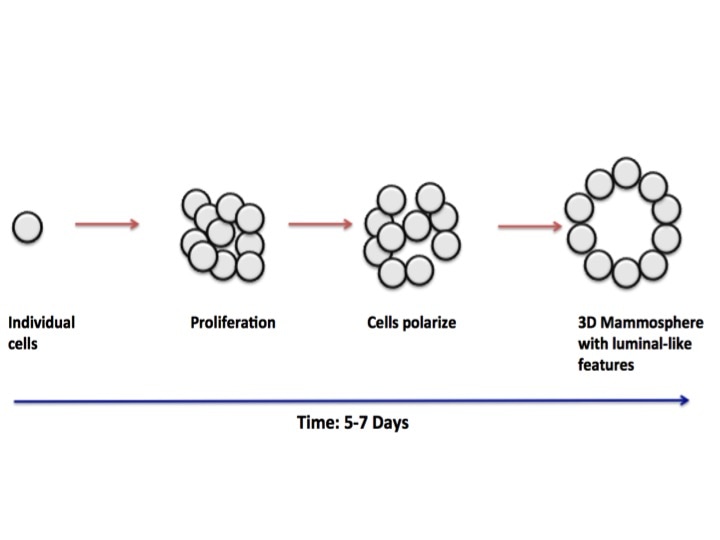
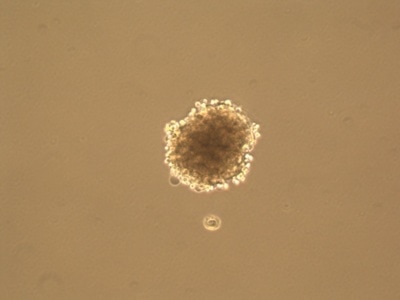
As you can see in the pictures, cells typically grow in 2 dimensions, i.e. they sit flat on the plastic and grow side by side. But you are not flat! You are in 3 dimensions. 2D culture is very easy, it’s cheap and it’s (relatively) fast. But if cancer has taught us anything it’s that they constantly mutate. When cells grow constantly in 2D they start to lose the ability to do certain things they would normally do in your body, for example the way they attach to each other. This is where 3 dimensional culture comes in. 3D culture allows the cells to attach to each other, typically in a ball or sphere (see pictures). These “spheroids” more closely resemble the body, giving researchers a better idea of what’s happening. The only problem is 3D culture takes A LOT of time, skill and patience. It is in fact very difficult and is not done in standard experiments yet.
Final words
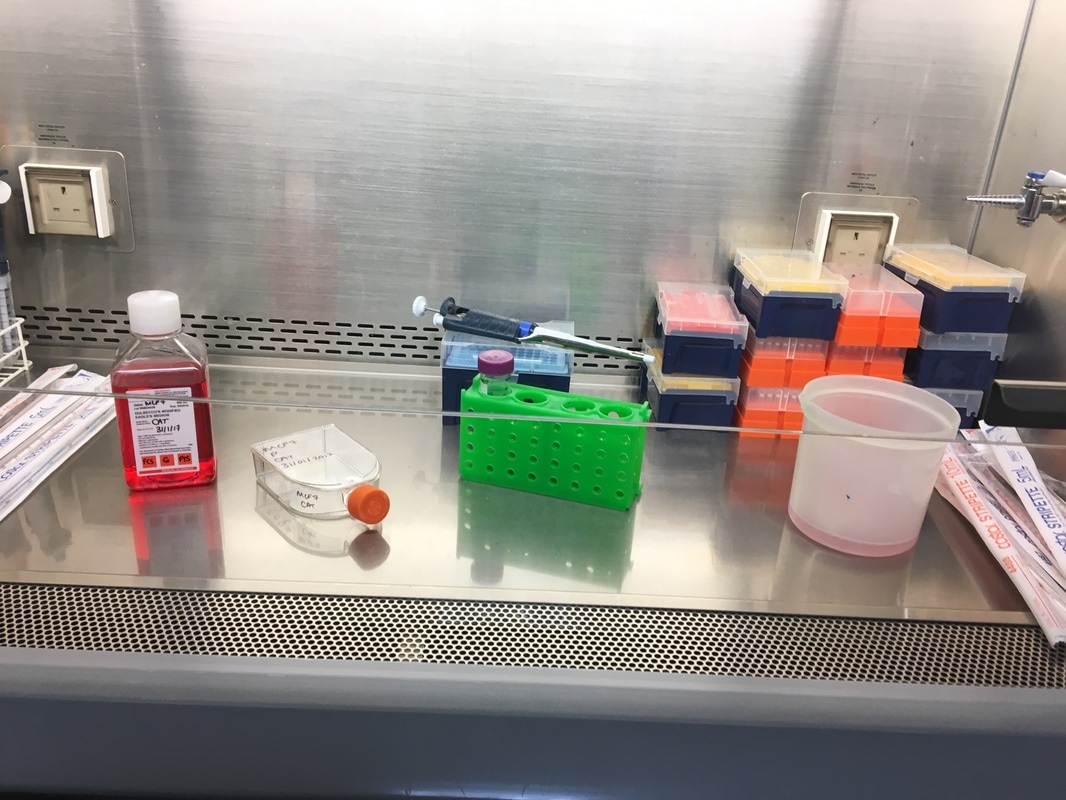
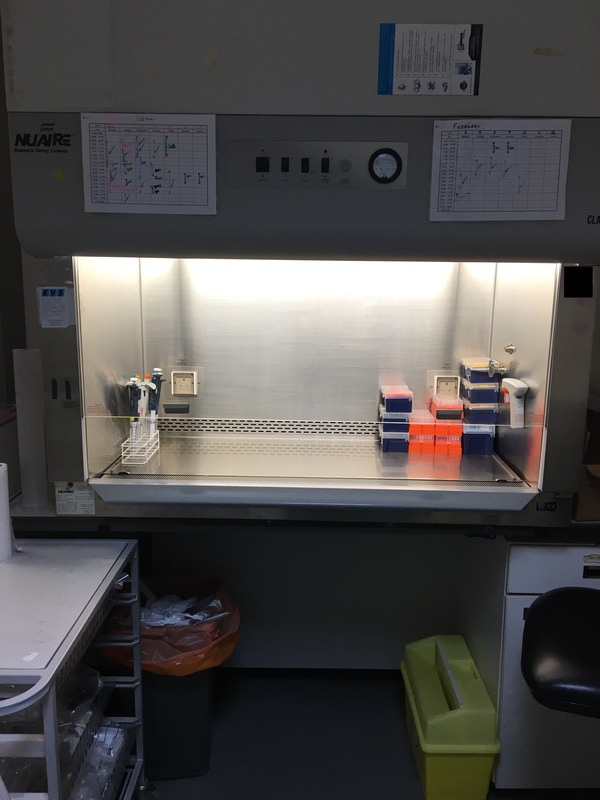
One final thing about cell culture, which anyone who has ever done it will attest to. Cell culture is back breaking. Because these cells are so important but also because they themselves can contaminate other cells very easily, you entire work is kept sterile. You are in a hood (see pictures) with a constant stream of filtered air. You can’t put lids etc. down so your arms are constantly in the air (not really able to rest on the hood) and you can only open the window a small amount, meaning a lot of awkward stretching. You could be in cell culture for hours and hours slogging through 3 to 4 different cell lines and making up lots of different experiments. And usually this is almost every day. But you cannot leave it, even for a day. These annoying little cells are the fulcrum around which your experiments are based. It’s odd to think about wanting to keep such deadly cells “healthy” and “happy” when all you want to do in the body is destroy them. But to destroy something like cancer you have to understand it, so I’ll keep the little feckers happy if it means keeping a human healthy. |
AuthorMy name is Caitriona and I am a PhD student at Imperial College London, UK. Categories
All
|

