|
In today's blog post I am going to talk about something very personal. I am going to talk to you about what research can do to you physically and why you need to protect yourself.
The physical price I have had to pay has not been a pleasant one. Ignoring the constant exhaustion because you're stress dreaming every other night about a decimal place, I have recently been diagnosed with repetitive strain injury (RSI) in my right wrist. For those that don't know me, my dominant hand is my right. This makes basic every day things like washing my hair and dressing a constant struggle. You can imagine how well I can pipette or type. What is RSI? Repetitive strain injury (RSI) is an umbrella term for injury caused to tendons or muscles that experience constant use. There are many types of RSI including carpal tunnel syndrome and tendonitis. In fact I have tendonitis and tenosynovitis (i.e inflammation of two tendons in my wrist and thumb and inflammation of the muscle sheath that covers them). The pain can reach all the way up into my elbow and shoulder. I also have a good deal of muscle weakness in my right wrist, thumb and fingers. For more information about RSI: http://www.nhs.uk/Conditions/Repetitive-strain-injury/Pages/Diagnosis.aspx What Happened? I started developing pain in my hand in September 2016 but, as I do, I ignored it. It wasn't until I had an extremely important, sensitive experiment to do in November 2016 did my hand pain become a massive problem. I was unable to fully stretch my fingers or make a full fist. I had an almost claw hand. My knuckles were sore and I had pins and needles in my index finger (almost like it wasn't my own). Bending my wrist in any direction was agony. This, as you can imagine, made using pipettes incredibly difficult. Thankfully I work with some extraordinary people. The lab manager here, Nahal, also suffers with RSI and recognised the signs immediately. She pushed me to seek help and to stop working. She even helped me with the final stages of my big experiment (I had been building up to it for a year). I got to use a fully automated single arm machine which plated up my experiments for me. It was amazing! With Nahal's help, along with others in my lab (Annelie, Francesca, Ayse and Ebtihal), I managed to finish my experiment with pretty decent results. Once I was done in the lab, I got help from the impeccable staff of the Occupational Health (OH) here in Imperial College London. They did assessments and in cooperation with my GP I had x-rays and blood tests. OH also provided physiotherapy to start me on the road to recovery. Thankfully I had a month at Christmas to rest my hand and (as you know) three weeks in France doing computer analysis to further rest my hand. I did go back to work after I came back from France, however I greatly reduced my lab hours to 1-2 hours per day, ONLY 5 days a week. What Caused my RSI? Working too hard. I mean working myself hard. For 9 months during the first year of my PhD I worked 7 days a week, up to 50-70 hours a week. 90% of this time was in a lab constantly doing experiments (sometimes up to 6 or 7 a day, all at the same time). I actually calculated that I worked more weekend days in a four month period than I had taken off from January to September (including a two week holiday in September and Easter). I am a bit mad, I'm not going to lie. It has been not-so-subtly suggested more than once that I should seek mental health care. I don't really self-preserve. I push myself a lot. I need to be perfect and when I'm not I punish myself for my failure. When I'm not in work, I drive myself mad thinking about work (remember I mentioned stress dreams). This constant need to push myself effects my sleep patterns, eating patterns and my ability to feel and ignore pain. I have low grade chronic lower back pain from a traffic accident in 2009 but anyone looking at me would never guess. I also have no ability to say "no". I have organised lab retreats, lab trips, charity events and raffles. I currently run the epigenetic unit meetings and manage (from a distance) the group journal club as well. As a CRUK funded researcher I have also said yes to (almost) everything CRUK have asked me to do. This means taking time off work to go to the PGA tour or half days to bucket collect etc. No matter what someone asks of me I will always say yes and give 1000%. And honestly, I love it. I love helping out, no matter what I'm asked to do. It gives me a sense of purpose, like I'm doing something right even if my lab work is going to hell. As I said I am a bit mad. But all of this has caught up to me and now my work and potentially my career is suffering for it. What is happening now (22/03/2017): It is not going well. While the break and medication did reduce my pain and help me feel like I was getting back to normal, I was in fact kidding myself. My wrist muscles are pretty weak. I keep dropping things, which as you can imagine in a lab can be dangerous, and the pain is almost as bad as it was in November. Currently I am doing physiotherapy with the NHS. I am in a splint which does not let me move my thumb at all and I am doing strengthening exercises (I've even set alarms to remind myself). I am no longer in the lab. I am only doing computer analysis and that is pretty damn slow itself. Writing and typing is like being stabbed with tiny needles. I no longer work weekends (even on the computer). I have even been reduced to just cardio in the gym (I exercise 5-6 times a week because it calms me and makes me happy) which is INCREDIBLY BORING! All in all I am recovering but slowly. The moral of the story? No matter what pressure you're under, no matter who puts that pressure on you, you need to protect yourself. My hand is my career. Without it I can no longer work in a lab. If I don't get over my own psychological issues and buck up I could be disabled for god only knows how long. This is WAY easier said than done. I am working on it. Part of the reason why I started this blog (you'll notice I started in November) is to alleviate some of the guilt I feel not working. For anyone who reads this who does lab or computer work PLEASE PLEASE PROTECT YOUR HANDS. I honestly mean it. I was you 6 months ago, not really paying attention to all those "ergonomic advice memos" and now I'm here, 6 months on struggling to wash my hair because my hand hurts so much. You do NOT want to be me! Thankfully I have become a bit of an example in my group and people are paying more attention to their working practice. I have brand new ergonomic pipettes (THANKS JAMES!!) and a new look on my working life. I will never have a relaxed attitude about working and being the best but I am definitely going to take my time from now on. I hope my hand does get better and I can get back some of my life 6 months ago (not all of it, weekends will have to become work free zones). I will keep you updated on how my recovery is going. 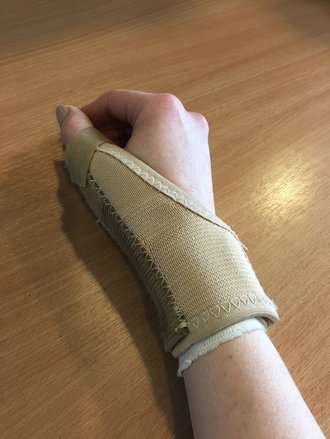
My fabulous splint!
0 Comments
I wanted to write a quick post to acknowledge something I think is pretty great! I was recently (and by recently I mean this morning) included on the European Association for Cancer Research (EACR) fortnightly member's email bulletin!!! It's a big deal for me because it gives me hope that what I'm writing here isn't completely inept!
I want to say thank you to EACR for believing that my little blog is worth publicising and hopefully I can make them proud! 

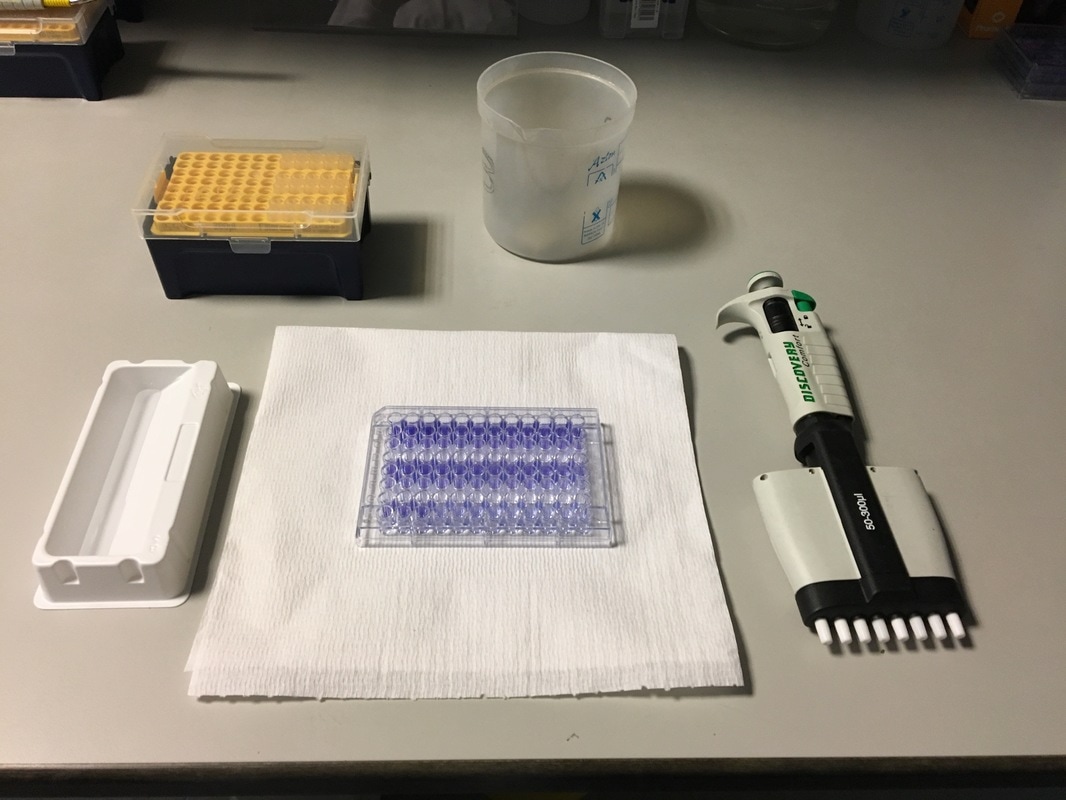
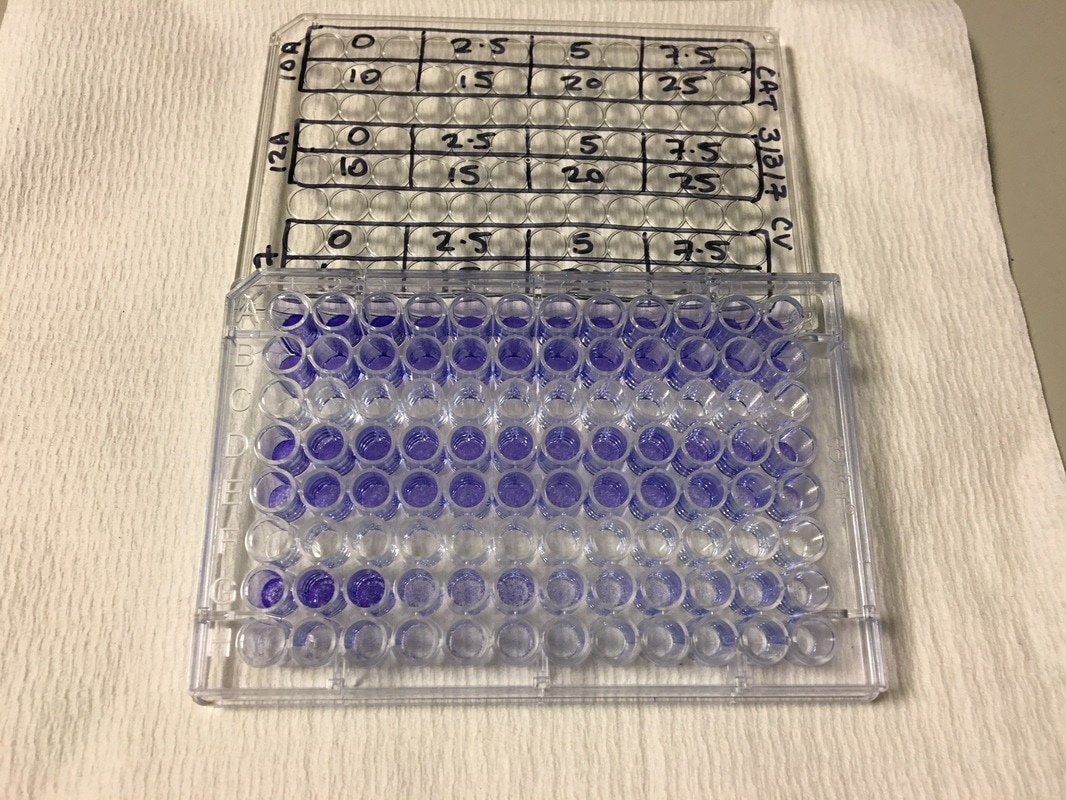
It's the last and final day of our cell viability assay. Today we will measure how much crystal violet there is in each well and analyse our data.
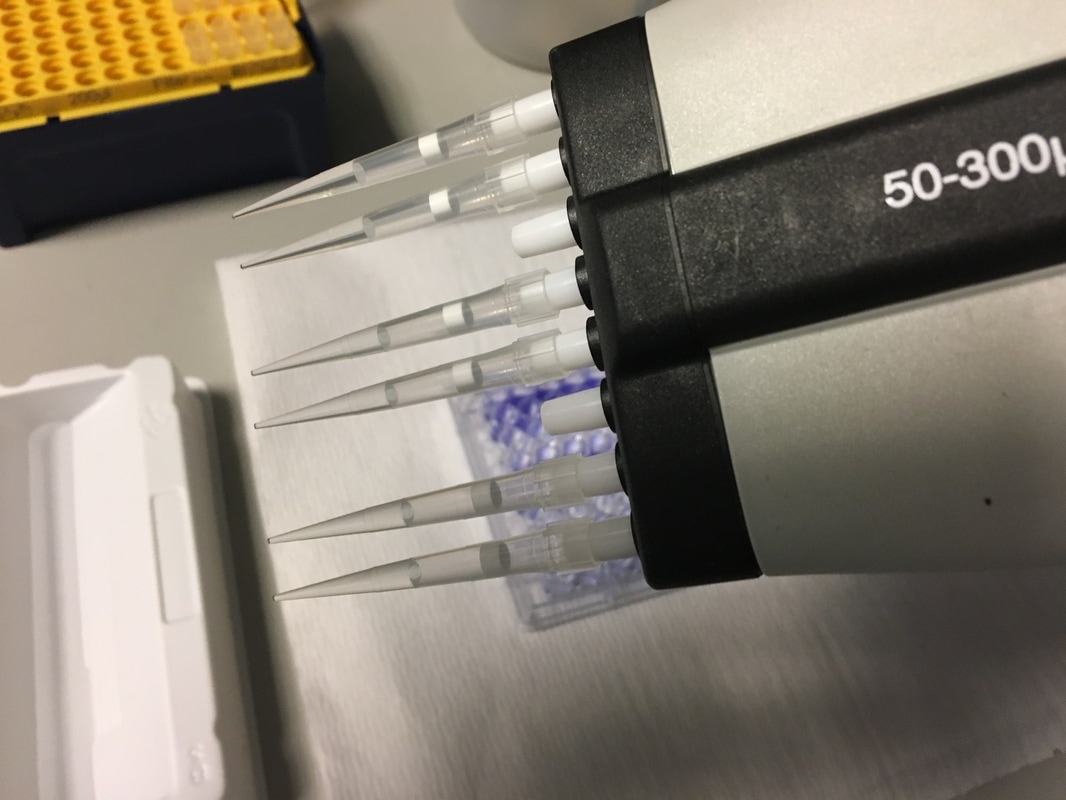
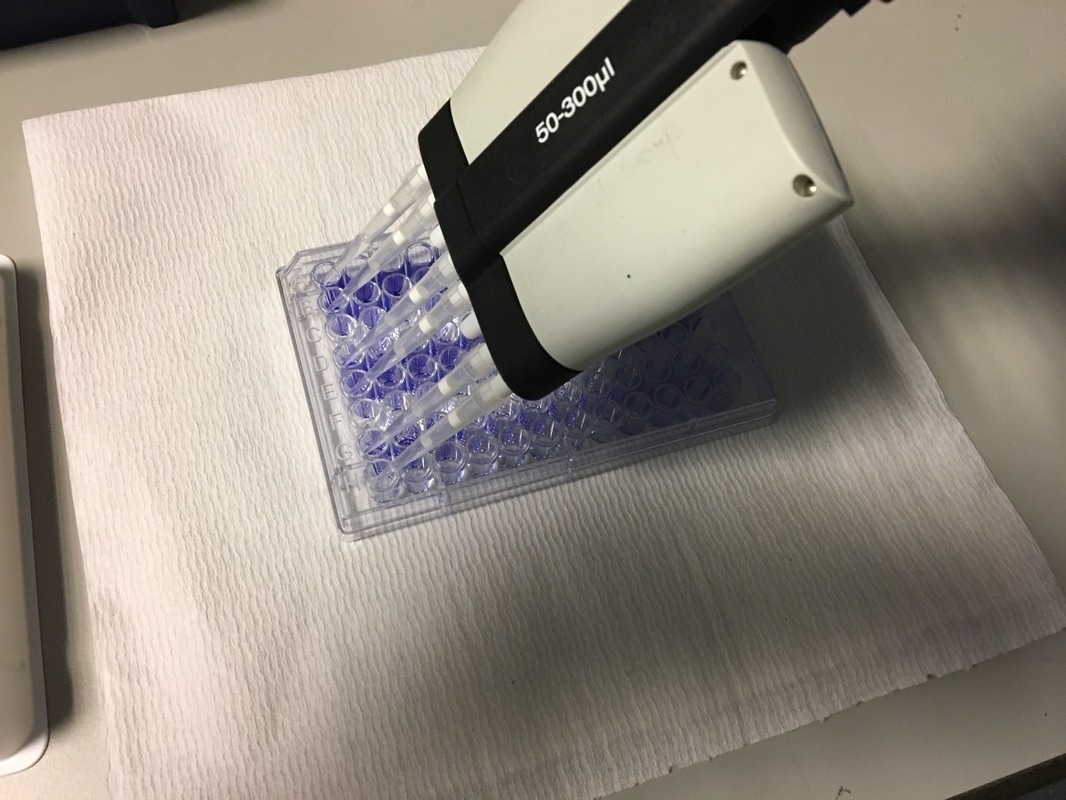
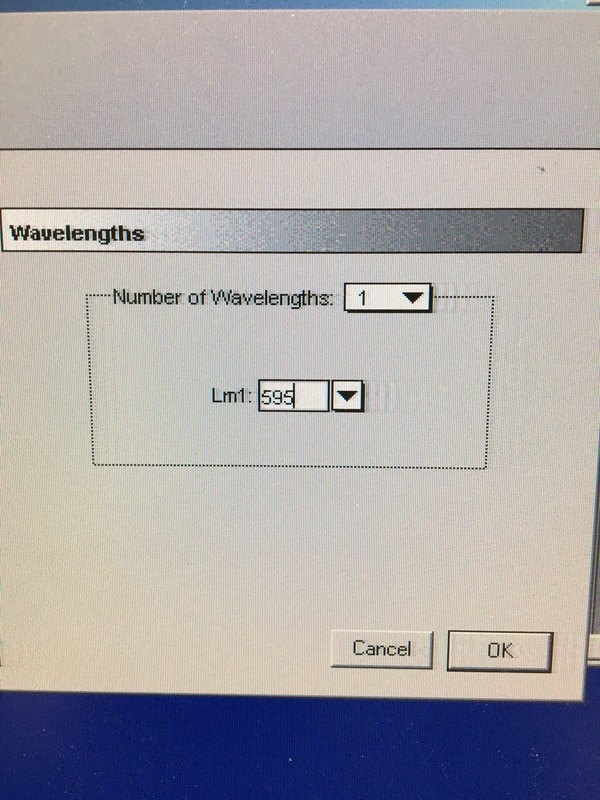
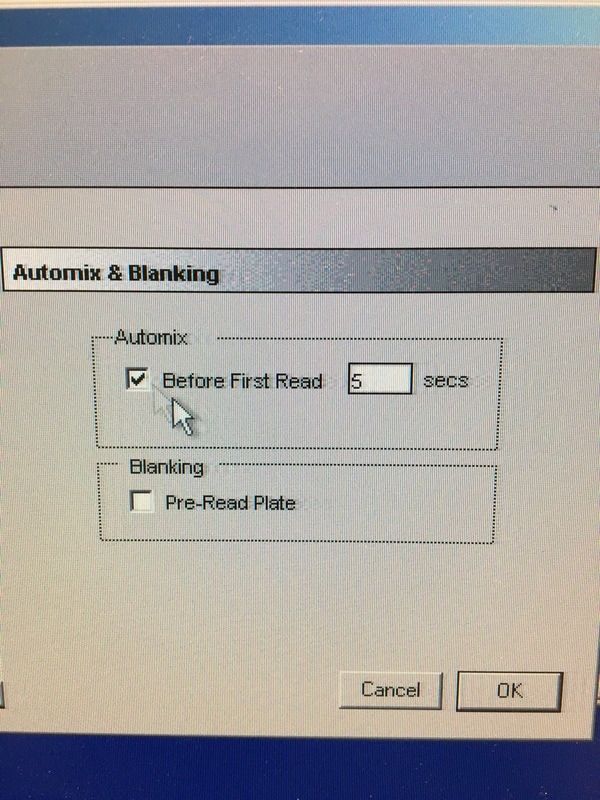
Part 1: Measuring Crystal Violet Absorbance To understand the next part I need to talk to you about absorbance. When light hits an object a certain amount of light bounces back which we see. For example white doesn't absorb light and bounces back almost all the light whereas black absorbs light and bounces back almost no light. The colours we see are different levels of light bouncing back from an object which is picked up by our eyes. Each colour has a different wavelength. The absorbance reader uses this principle. The reader (in picture 4) sends light into each well of the plate. It then measures how much light is absorbed. The higher the absorbance, the less light bounces back or the more light is absorbed by the object. We tell the machine what wavelength crystal violet is on, in this case it's 595nm. But the crystal violet we have is dried into the attached cells. We can't measure absorbance this way as the absorbance reader needs a liquid. So we dissolve the crystal violet in 10% acetic acid (which is essentially vinegar). The vinegar draws the crystal violet from the cells, allowing it to dissolve in the liquid. We add 80ul of 10% acetic acid to each well. This MUST be exact. The absorbance reader uses light absorbance and the volume of liquid to make its measurement. If the liquid is different in each well, the absorbance measurement will also be different. As shown in pictures 1-3, the 10% acetic acid is added to each well and placed on a rocker for at least 20 minutes. This aids in drawing out the crystal violet dye from the cells. We also add 80ul of 10% acetic acid to three wells with no cells in them. This is our blank. The plate itself and the acetic acid will have a small absorbance. We call this "background". We want to remove the background to make sure the data we use is completely from the the cells attached to the wells. We then place the plate into the absorbance reader machine and set the wavelength to 595nm. To make doubly sure that all the crystal violet is dissolved into the 10% acetic acid we set the machine to automix for 5 seconds before reading the plate. The machine essentially gently shakes the plate (picture 6).
Part 2: Analysing the Data
Once the machine has read the absorbance of the plate it gives you a read out (for example picture 7. I will point out this is an old picture and not our results). 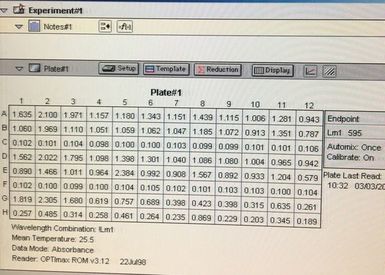
Picture 7: An example of the output from an absorbance reader
We can then export this to excel (picture 8). I have highlighted the wells for each cell line and also each dose. As you can see the white wells are the absorbance given by the plate. The first three wells on line 3 are our blanks.
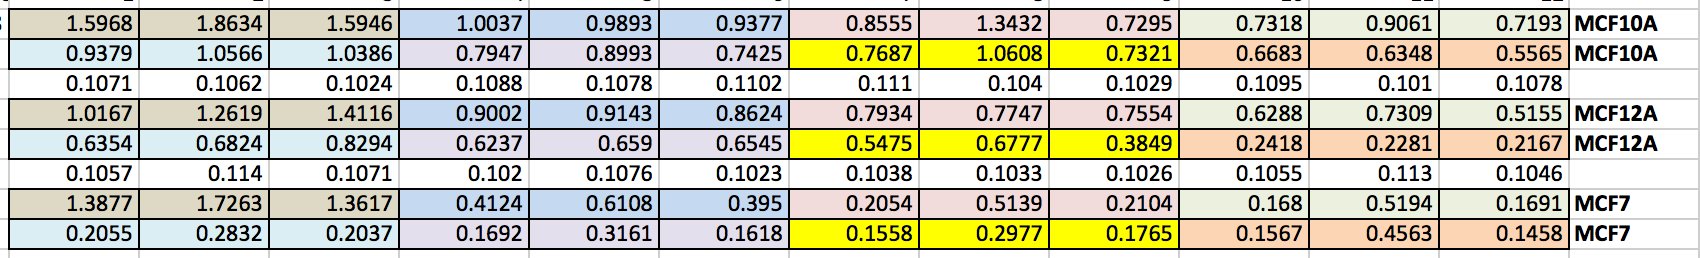
Picture 8: The results from our experiment. Brown = 0mM, blue = 2.5mM, pink = 5mM, green = 7.5mM, turquoise = 10mM, purple = 15mM, yellow = 20mM and orange = 25mM
We then want to analyse our data (picture 9).
We take an average of our blank as well as our data. As I said in Day 1, we do everything in triplicate (called a biological triplicate). This allows us to average over the three wells and should even out discrepancies between wells. These discrepancies can be caused by technical error (e.g. treating or adding the 10% acetic acid) or by the equipment (e.g. the pipette etc.). Before we average our data, we take the average of the blank from each well (see B17 - D24). We then average our data and make this into a percentage. We then calculate the standard deviation and standard error. This tells us how close our triplicates are to each other. The higher the STDEV and SERROR, the more differences there are between triplicates. This give us our error bars. As we have only done one experiment, there are no error bars but once you do three or more and average across experiments you can then add the error bars. We then plot the results on a smooth scatter plot (picture 10). 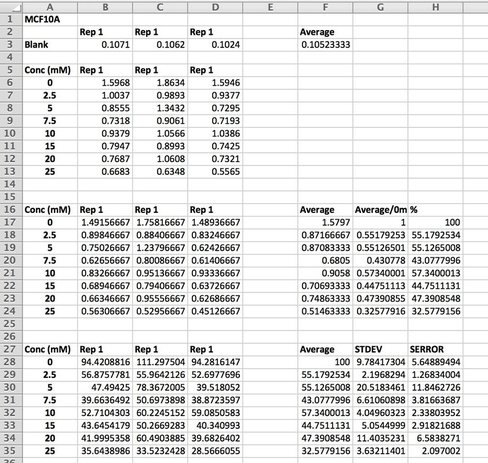
Picture 9: example analysis from one cell line, MCF10A non-cancerous breast epithelial cell line
Picture 10 finally shows the results of our experiment. As you can see, we have not gotten what we expect. A typical assay like this where we know the drug kills cells should have a smooth line which decreases or doesn't change as you move across doses. This is evident in MCF7 (green line) however it is not perfect, as it starts to increase at the highest dose. In our two non-cancerous cell lines MCF10A (blue) and MCF12A (orange), there is a lot of up and down. This shouldn't look like this. How I know is by looking at the triplicates for these two cell lines and the standard error. You can see that in some cases (picture 9), all the triplicates are similar however in others, there is one triplicate which is higher than the rest by a significant amount. For example in picture 9, row 20B, the second triplicate for 7.5mM is much higher than the other two. This will throw off the average, making it higher then it may actually be. The standard error is also very high in some concentrations, making me think that technical error is putting the results off.
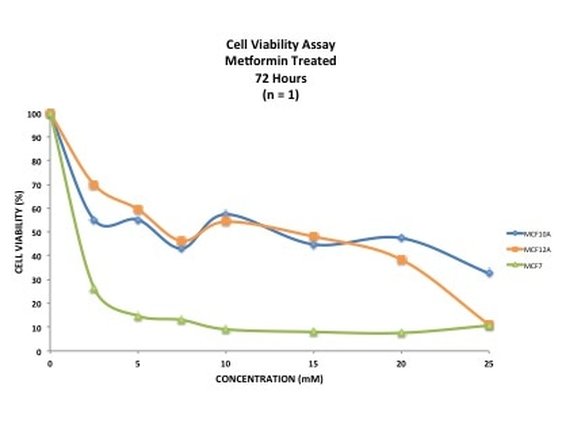
Picture 10: Scatter plot showing results from Crystal Violet cell viability assay on MCF10A (blue), MCF12A (orange) and MCF7 (green) cell lines. Cells were treated for 72 hours with Metformin at varying concentrations (mM). n = 1.
There are a number of reasons why this could happen:
This demonstrates that 1) your experiment will always go wrong at least once, especially when you first do it and 2) how important it is to repeat your experiments at least three times (called a technical replicate). These results could be due to technical fault or they could be real. By running the experiment three (or sometimes more) times you eliminate one of those possibilities, leaving the other. Once we have our final data we can work out the IC50 - this is the concentration of drug needed to kill or reduce viability of 50% of the cells. It is a good indicator as to how much drug you want to use. If you want (like me) to induce an effect from drug treatment but not kill off all the cells then you use a concentration lower than the IC50. However if your aim is to decimate the cells then you would use concentrations above the IC50. Unfortunately the data is a bit haphazard to get an accurate IC50 from. And that's it. This experiment will need to be done a few more times to see if it's technical error or if the cells really do this. I will post up the results of those experiments when I have them and hopefully we shall see something interesting. I will also show you how to calculate an IC50. I really hope that you have enjoyed doing this experiment with me and now have a little bit of an idea about what goes into an experiment like this. If you have any questions or comments please don't hesitate to comment below or send me a message on the FAQ page. 
It's day 6 and our cells have been living in our drug Metformin for 3 days. Today we will start Part 1 of 2 of our Crystal Violet Experiment.
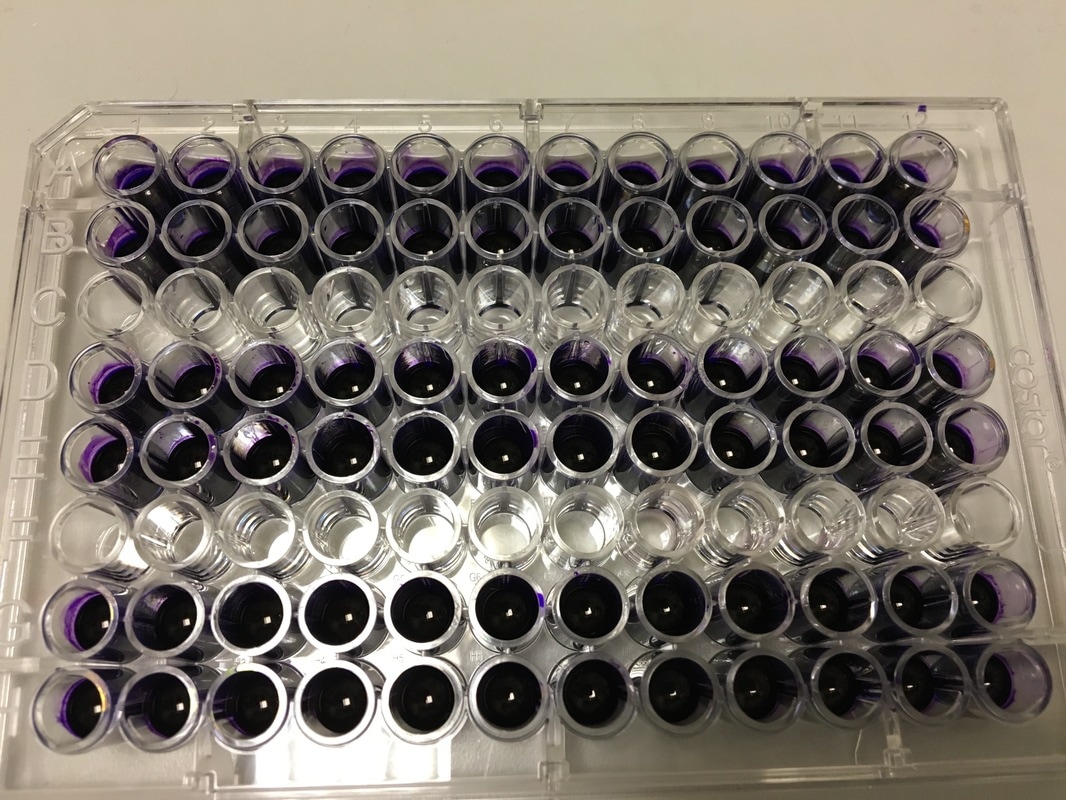
To re-cap: Crystal violet ONLY stains cells that are attached to a culture plate by dyes proteins and DNA within the attached cells. So we want to stain our cells and see how many are "alive" or left on the plate. Part 1: Staining with Crystal Violet First off I want to apologise for the lack of images. Crystal violet is messy and I can only take pictures when I'm not wearing a lab glove. So I choose safety over pretty pictures (Nahal would be proud). The first step with any experiment (as I've shown before) is preparation. I like to get all my reagents, pipette tips etc. ready before I start (as seen in picture 1). The next step is to get rid off the media from the plates into a sink. We then wash the well (like we did when making our cell suspension) with PBS twice, about 200ul. The PBS is removed each time into the sink (by a highly scientific technique of dumping it out in a chucking motion). 80ul of crystal violet is added into each well (picture 2) and left on a rocker for at least 20 minutes. This spreads the dye evenly around the wells and makes sure the cells that are attached take up the dye.
Part 2: Removing the Crystal Violet
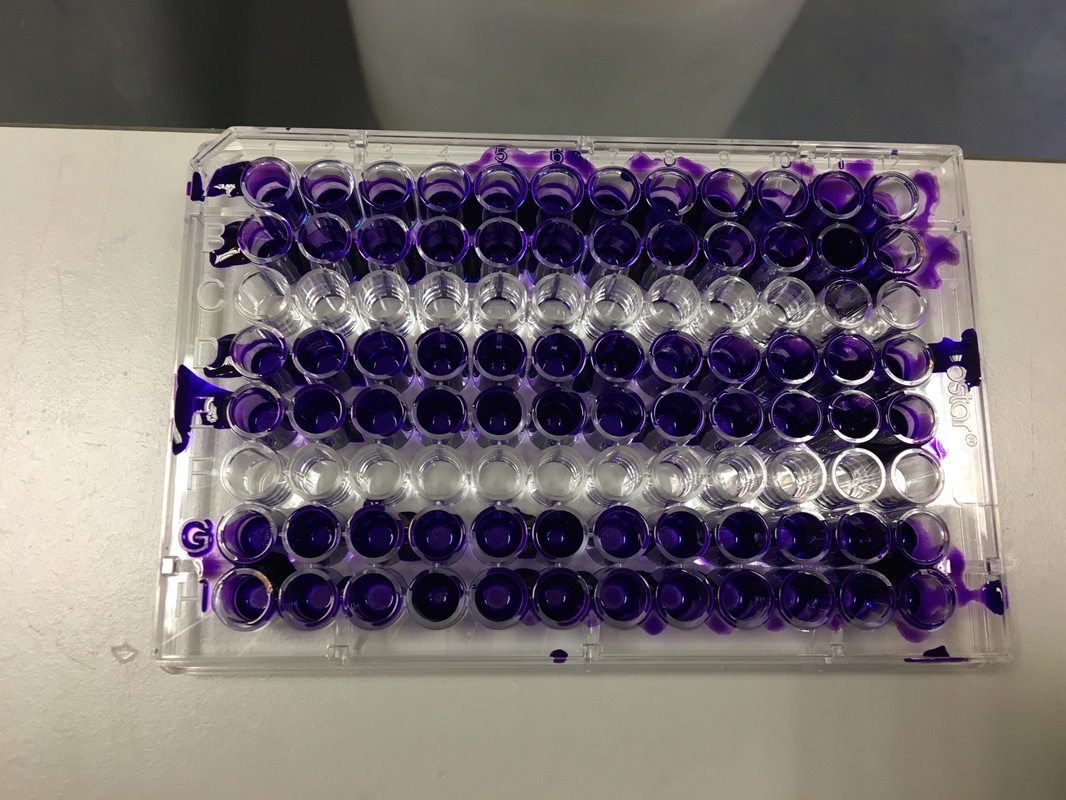
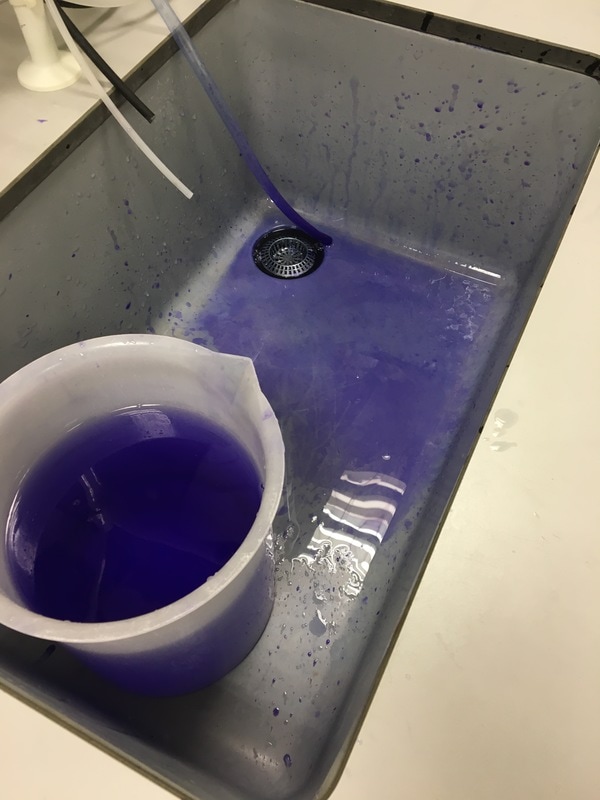
THIS is when it gets messy. This dye stains everything and is difficult to wash off so we first get as much of it out of the well as possible into a specific container in the fume hood (picture 3). We then wash off the excess. We have some very technical equipment here: a bucket and a sink (picture 4). We fill the bucket with cold water and dump the plate into the water. This fills the wells with water and then we chuck it into the sink. You can understand why this gets messy and turns the sink purple (a little ethanol gets that right off). You keep doing this until the water coming out of the plate is clear. This means all the excess is removed and the purple that is left is only absorbed by attached cells.
Part 3: Drying the Plate
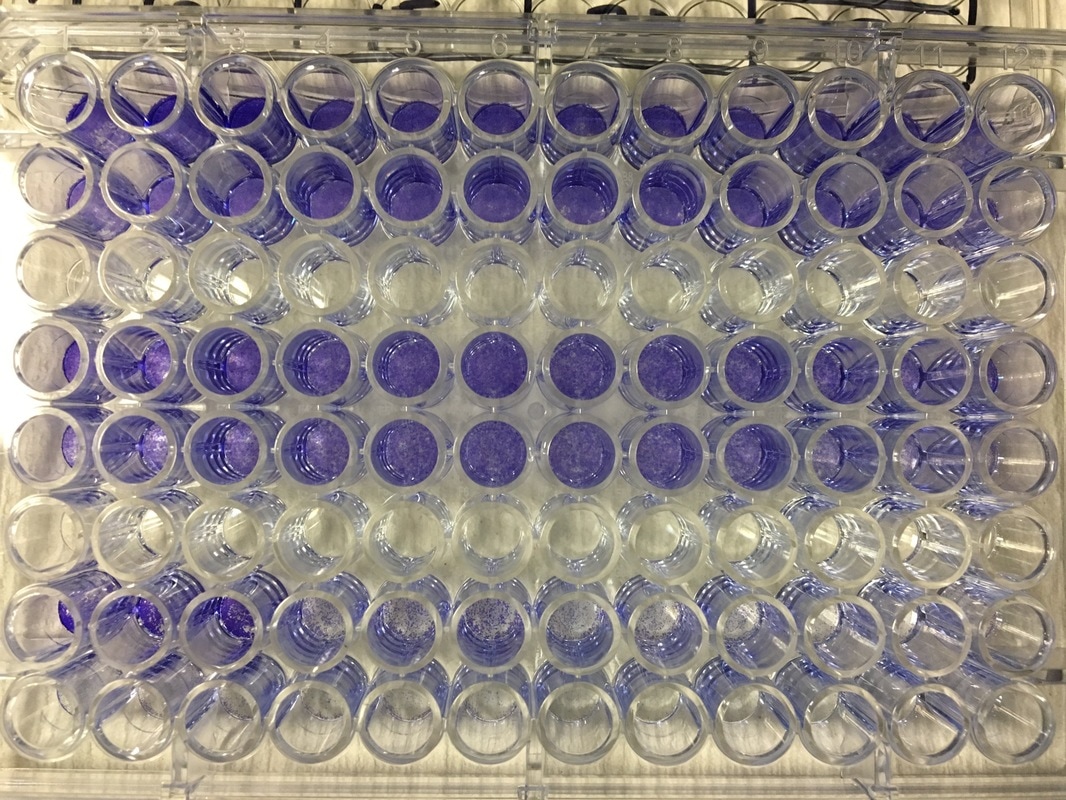
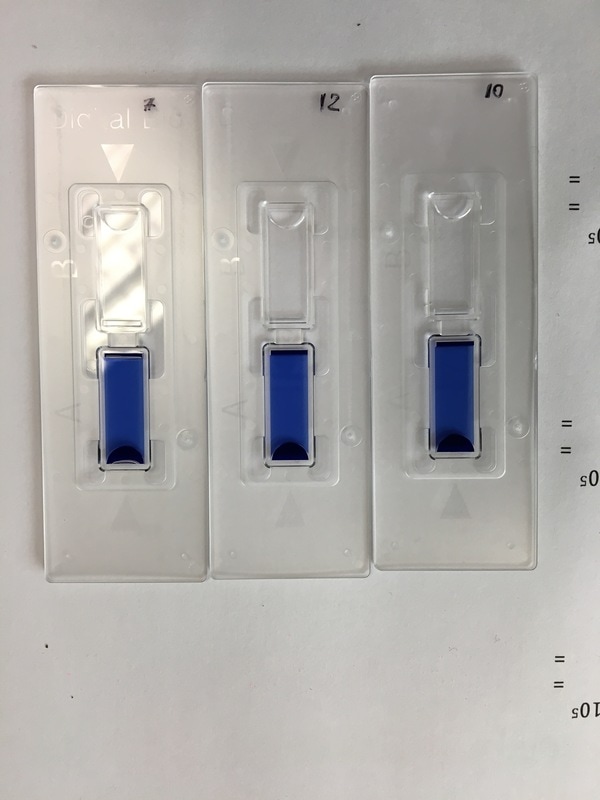
It's important to let the plate dry for a few hours or preferably overnight. This allows any water to evaporate. We will be measuring how much crystal violet is in each well tomorrow and we don't want the water to mess up our results. As you can hopefully see in picture 5 and 6, some of the wells have a lot of purple dye and some have barely any.
And that's it for today. I know it is very slow but this really is what science is. When you do experiments the majority of the time you do a little bit one day, a little bit another and you end up waiting for hours and hours for something to happen. Which is why it can be so frustrating when it goes wrong. This simple experiment takes 7 days to complete, imagine the time spent doing more complicated experiments.
So that's it for today. Come back tomorrow to finish the last part of our experiment. We will read the absorbance (I will explain tomorrow) of our crystal violet staining and then analyse our data. 
It's Day 3 and today we will be treating our cells with the drug Metformin.
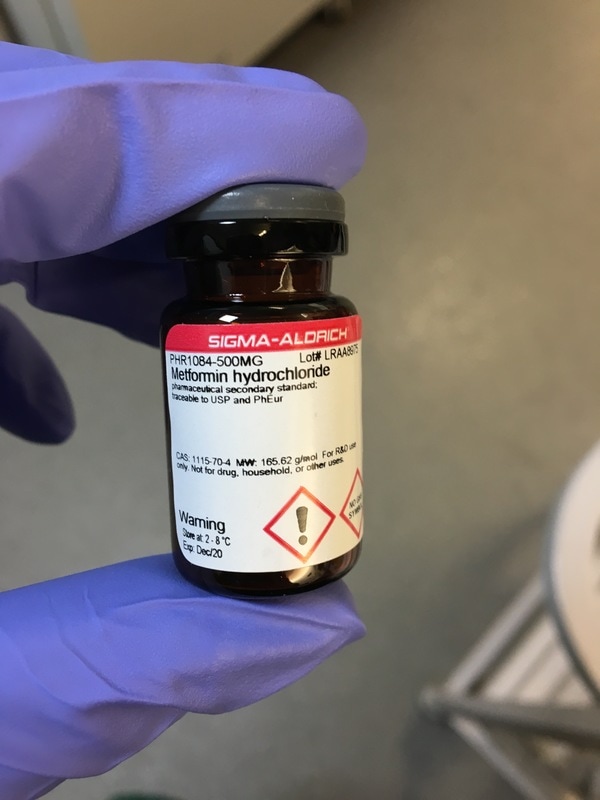
Just a bit of background on Metformin. Metformin is a Type II Diabetes Mellitus (T2DM) drug that has been used since the 1950s. It is the most commonly prescribed T2DM drug meaning most people who have T2DM will have been prescribed Metformin at some point during the course of their disease. We know that Metformin targets mitochondria. Mitochondria are the batteries in your cell where the energy to run your cell is made. You can have hundreds and hundreds of mitochondria all working to keep the cell ticking along. Interestingly, all your mitochondria come from your mother. In T2DM you develop insulin resistance. Basically insulin (a hormone made in your pancreas) tells cells to take up glucose from the blood after eating. But T2DM patients make their OWN glucose and don't need to listen to insulin. Your pancreas finds this confusing so churns out more and more insulin, thinking "they'll listen to this!" Eventually your pancreas gives up and you have all this unused glucose floating around in your blood. What Metformin does is it stops your cells from making its own glucose. This forces the cells to listen to insulin and start taking up glucose from the blood. But Metformin also interacts with a whole HEAP of other pathways in cancer alone (some of which are in picture 1) and no one knows why or exactly how. Which is where I come in (in part)! 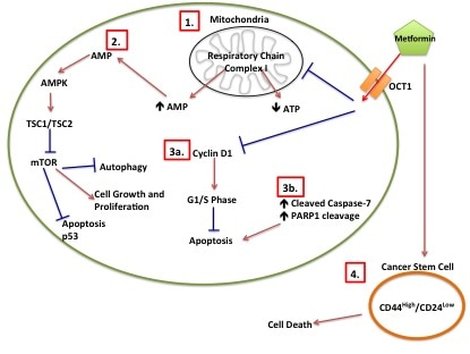
Picture 1: Metformin Proposed Mechanisms of Action in Cancer. (1) Metformin inhibits mitochondrial respiratory chain I which leads to decreased ATP and increased AMP. (2) Increased AMP leads to increased AMPK, which inhibits mTOR. (3a) Metformin inhibits Cyclin D1, which prevents cells from going into G1/S phase. (3b) Induction of apoptotic intermediates such as cleavage of Caspase-7 and cleavage of PARP1 leads to apoptosis. (4) Metformin induces cancer stem cell death.
So now we know what our drug does, on to the treating.
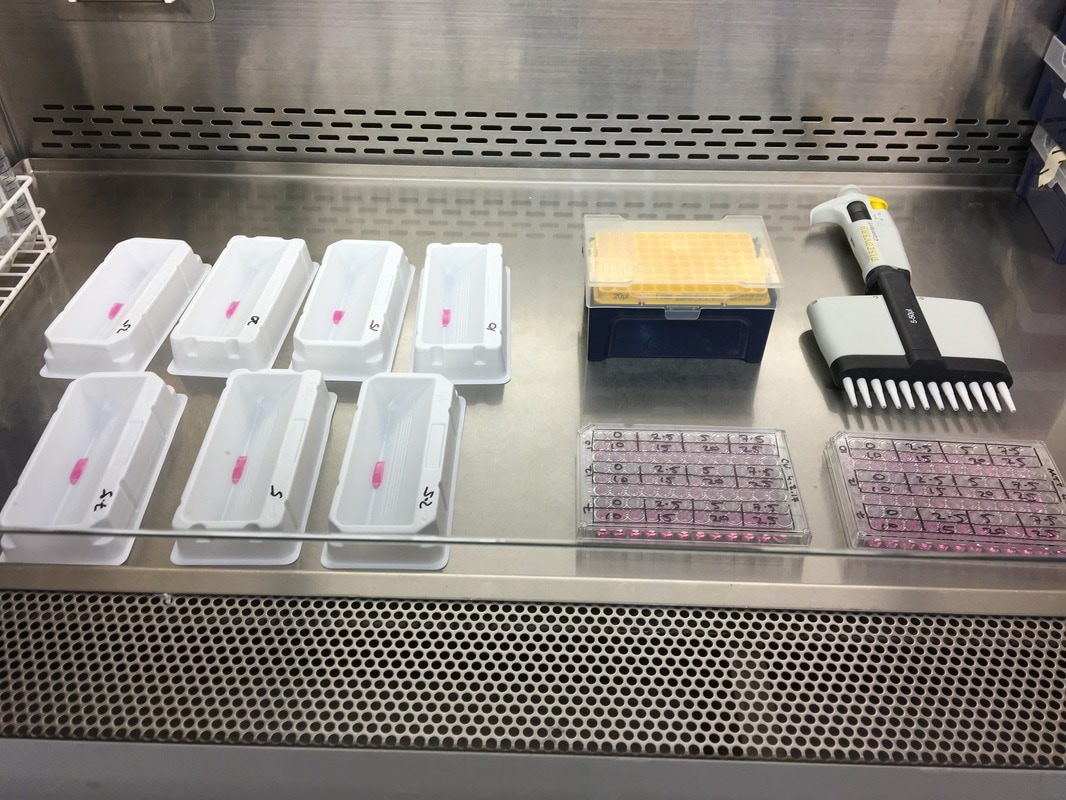
Part 1: Planing the treatment So before we start with the treating we need to know how much we are treating with in mM and convert this to a volume. I've done this part as a picture (picture 2) as it's easier to explain. We have our stock concentration of Metformin which is 1M or 1,000mM. We want to have a gradient of 7 concentrations (see picture) so we need to work out what volume of drug we need to have that concentration in each well. We then scale this up to however many wells we need (in our case it's 10). The calculation is: (WANT/HAVE) x FINAL VOLUME This gives you the answer in ml. We want ul so you multiply by 100 to get the volume of drug for 1 well in ul (see table). We want to do this for 10 wells so we multiple the volume of drug again by 10 giving up the volume of drug in ul for 10 wells (see table). We then need to calculate how much media we require to dissolve our drug into. Because we don't want to disturb the cells at this point, we don't remove all 0.1ml of media. We instead remove a 5th of the media (or 20ul) per well. So you multiply 20ul by the number of wells you want to treat giving you 200ul total. We then take the volume of drug away from the total volume of media (like with our plating) leaving you with the volume of media in ul for 10 wells (see table). The cells will still receive the same amount of drug in each well don't worry. 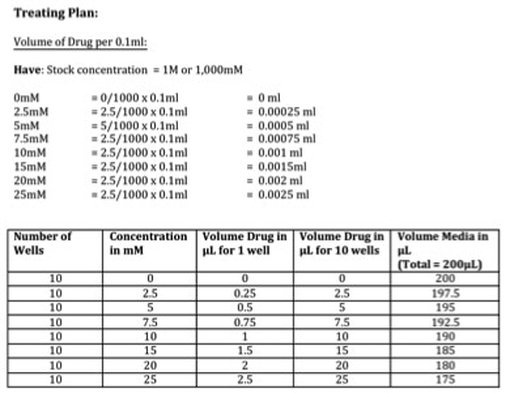
Picture 2: Treatment plan for Metformin 96-well crystal violet assay
Part 2: Treating Our Cells
Once we've calculated all of the above we then make this up in labelled 1.5ml eppendorf tubes. Again we will use a multichannel pipette to treat the cells (due to the wrist injury) so we transfer our drug + media into labelled reservoirs (see picture 4 - picture from earlier experiment apologies). We add the appropriate drug to the appropriate wells (e.g. 2.5mM to the three 2.5mM wells) and leave in an incubator at 37°C and 5% CO2 for 72 hours or three days. The cells don't need to be retreated because this a short time course experiment.
And there you have it! We have now plated and treated our cells with our drug. We now wait three days to allow the drug to do its thing.
Come back on Tuesday 7th March to see how we do the next (and messiest) stage of our experiment: Crystal Violet! 
So to recap from yesterday...we planned our cell viability assay to test whether the Type II Diabetes drug Metformin can reduce cell viability of three cell lines - MCF10A, MCF12A and MCF7.
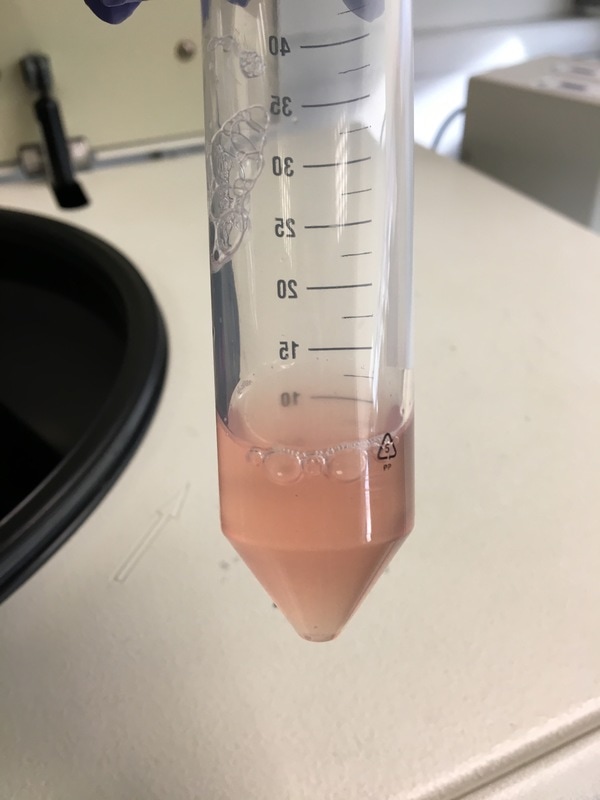
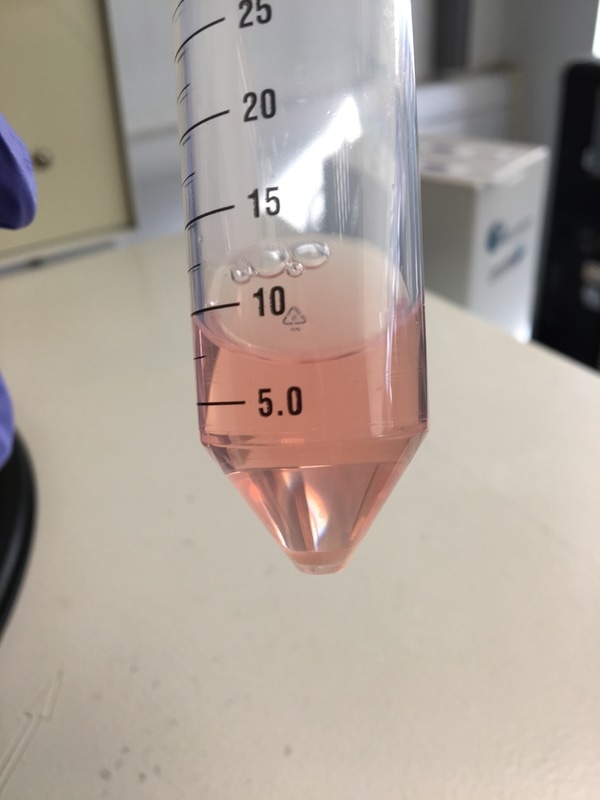
Today! We will start our experiment but plating our cells into the 96-well plate to treat. Day 2: Plating Our Experiment It's important to remember our information we had yesterday (reagents, equipment, plate plan). Part 1: Making A Cell Suspension As I've explained before the cell lines are grown in a flask and attach to the plastic. But we want them to detach to be able to plate them up (don't worry the majority will survive not detached for a short time). This is called a cell suspension. We create a cell suspension by first removing the media. This gets rid of all the dead cells. The media also inhibits the reagent we'll use to detach the cells so we need to get rid of it. Once the media is removed we wash the flask with PBS to make sure that there is NO media left. PBS (or phosphate buffered saline to those interested) is a clear liquid that does not react with other liquids or cells and is often used for washing cells etc. (like soap but less harsh - also we don't use soap on cells...). Once the cells are nice and clean we add EDTA/Trypsin. Basically these chemicals together "scrape" the cells off the bottom of the flask (for more in depth explanation see yesterday's post). Depending on the cell line you use this can take 2 minutes (MCF7) or 15 minutes (MCF10A and MCF12A). After you leave it for it's needed time all the cells detach off the plate, leaving you with a cloudy liquid chock-full of cells (see picture 2). BUT EDTA/Trypsin is toxic to cells and will eventually kill them so you need to neutralize it. Remember when I talked about media and what it does to EDTA/Trypsin? You got it. We add media to the cell suspension to neutralize the EDTA/Trypsin. We then put the cell suspension in a 50ml falcon (see picture 3). As you can see it's all cloudy because of all the cells floating around. We could use these cells however there is a chance that not all of the EDTA/Trypsin is neutralized so we want to get rid of the liquid and replace it with new liquid while keeping our cells. We do this by first centrifuging the cells at a very low speed. The centrifuge will force all of the cells to fall to the bottom of the flask because they are "heavier" than the liquid (see picture 4). We can then take off the liquid while leaving the cells intact and add new media (free of toxins). This puts the cells back to floating around (like picture 3) and there we have our cell suspension.
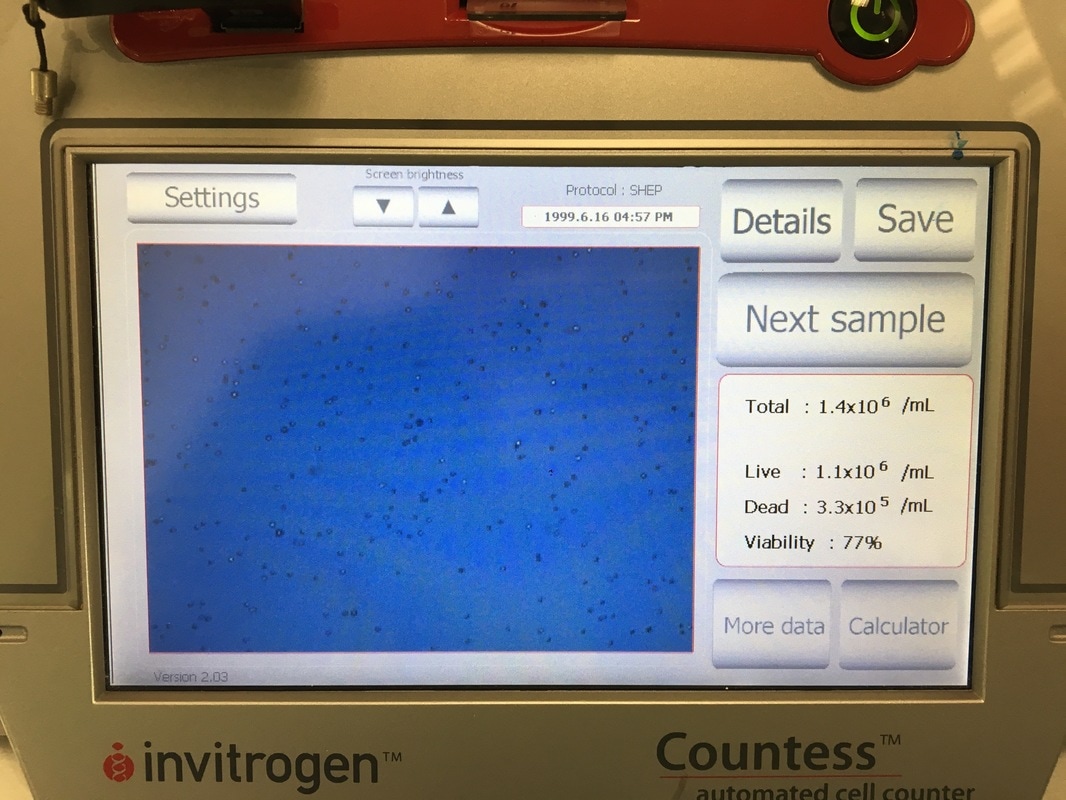
Part 2: Counting Our Cells
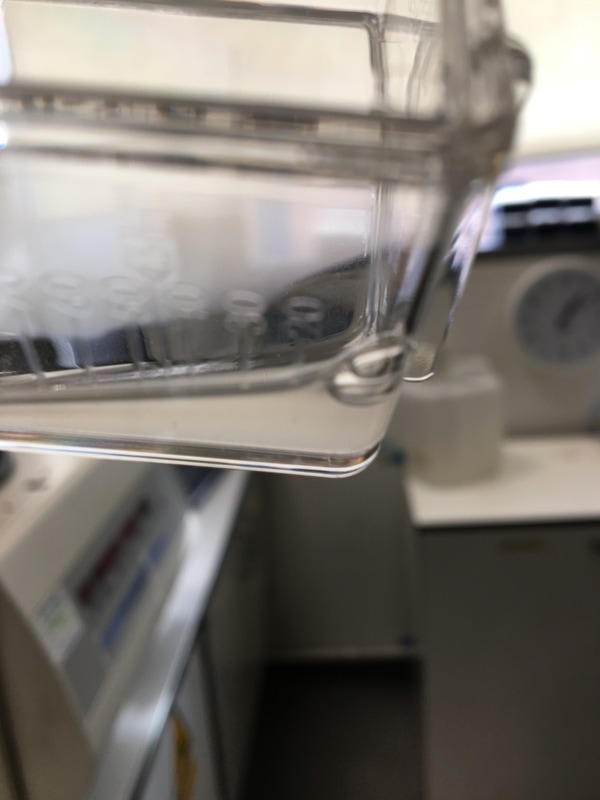
It is important in an experiment to have a similar number of cells in each cell line at the END of the experiment so we can make comparisons. As I said before, these cell lines all grow at a similar pace so plating the same number of cells should give us roughly the same number of cells at the end of our experiment. Now we're hypothesising that Metformin will "kill" some of these cells but it may do this better in some cell lines compared to others. So how do you know you have the same amount of cells at the end? We add a control. The control is 0mM on our plan. This basically has no drug added to it, meaning they should grow without dying (too much) and will represent the total number of cells alive (or 100% alive cells). So on to counting. Cells are counted by adding a blue dye (not crystal violet) but another dye, Trypan Blue. Trypan blue ONLY stains cells that are dead. So we can distinguish between alive (white) and dead cells (blue). Now you can do this manually under a microscope OR you can do it the way I do it which is with a machine! The machine measures how much blue and how much white there is an calculates how many alive cells there are in 1ml of your cell suspension. To do this we take 20ul (which is microlitres or 0.002ml) of trypan blue and add it to 20ul of cell suspension. We then put it in a little cartridge (picture 5) and place it into the machine. The machine then counts the cells and tells us how many we have (picture 6 - total). It tells you how many cells are dead, how many are alive and how good your sample is (viability %). I use the total value because I find that when I use the "Live" value my plates are always over confluent at the end of the experiment (i.e. there's too many cells and not enough space so the cells start to die). But that's me. When I use the "Total" value the controls all have very similar cell numbers at the end so I'm happy with that.
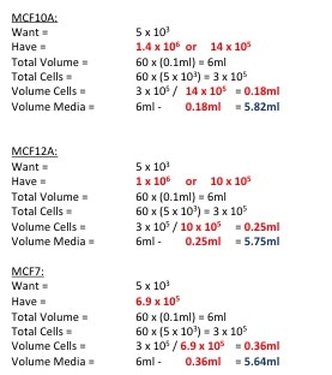
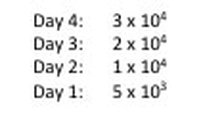
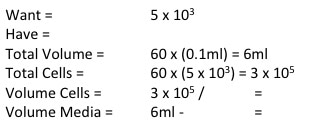
Now to calculate how much cell suspension we need and how much media we need (picture 7). First we convert our "Have" value to the same number are our "Want" value (i.e. make sure the "Have" value is x105). In the case of MCF7 we don't need to do that but for MCF10A and MCF12A we do. So we take one 10 away from x106 and multiply the number before the x by 10. We then divide WANT/HAVE. This gives a value in ml telling us how much cell suspension we need (Value in RED). We then take that away from the "Total Volume" to get how much media we need (value in BLUE).
Part 4: Plating Our Experiment (YAY)
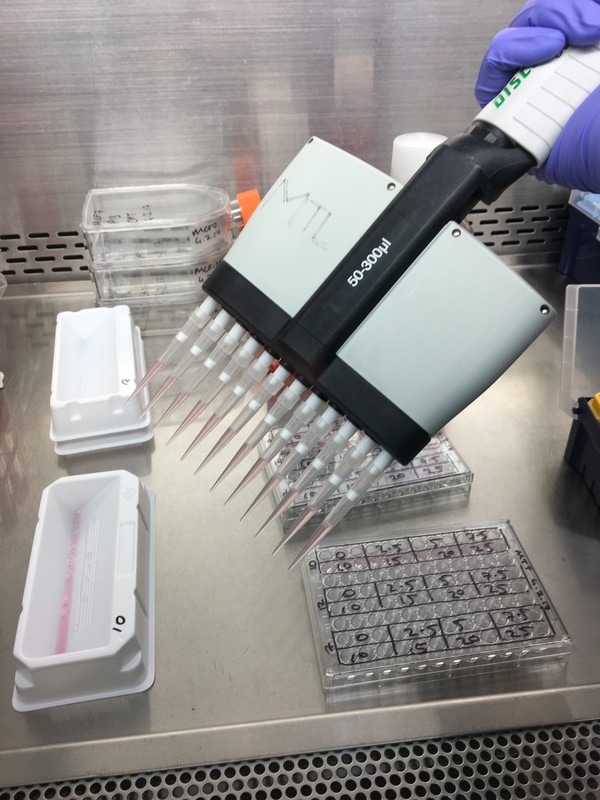
We now have everything we need to plate. We have our plating plan and we have the volumes of cell suspension and media. The final thing we do before we start is draw our plate plan onto the lid of our plate just so we don't forget which well is which. We also label the cell lines and add our name, date and experiment (picture 8). To plate our cells we add the final volume of media to the final volume of cell suspension in a labelled 50ml falcon. We next use a multichannel pipette to add the cells to the plate (see pictures 9 and 10). This is for three reasons: (1) this ensures equal distribution of cells, (2) it's faster then doing each well individually and (3) I have a wrist injury so using a multichannel pipette makes life easier. The multichannel takes up 0.1ml of cell suspension from a reservoir into each pipette tip and adds it evenly to each well. Once all the wells you want to be plated are full of your chosen cell line you then leave the plate in an incubator at 37°C and 5% CO2 overnight.
And that's it! We have now plated our experiment!!!
Tomorrow we will be treating our cells! So exciting!! NOTE: Apologies for the late posting, I was at a conference today and had no time to write this up. 
I am trying a little experiment today. I am aiming to take you as a reader through an actual experiment as I do it. This means taking you through day by day from planning to analysing the data. Hopefully it will give you an idea about (1) how an experiment is run and (2) what you do when it goes wrong.
Before I start I want to introduce our experimental models. I have three cell lines that we will experiment on:
DAY 1: Planning
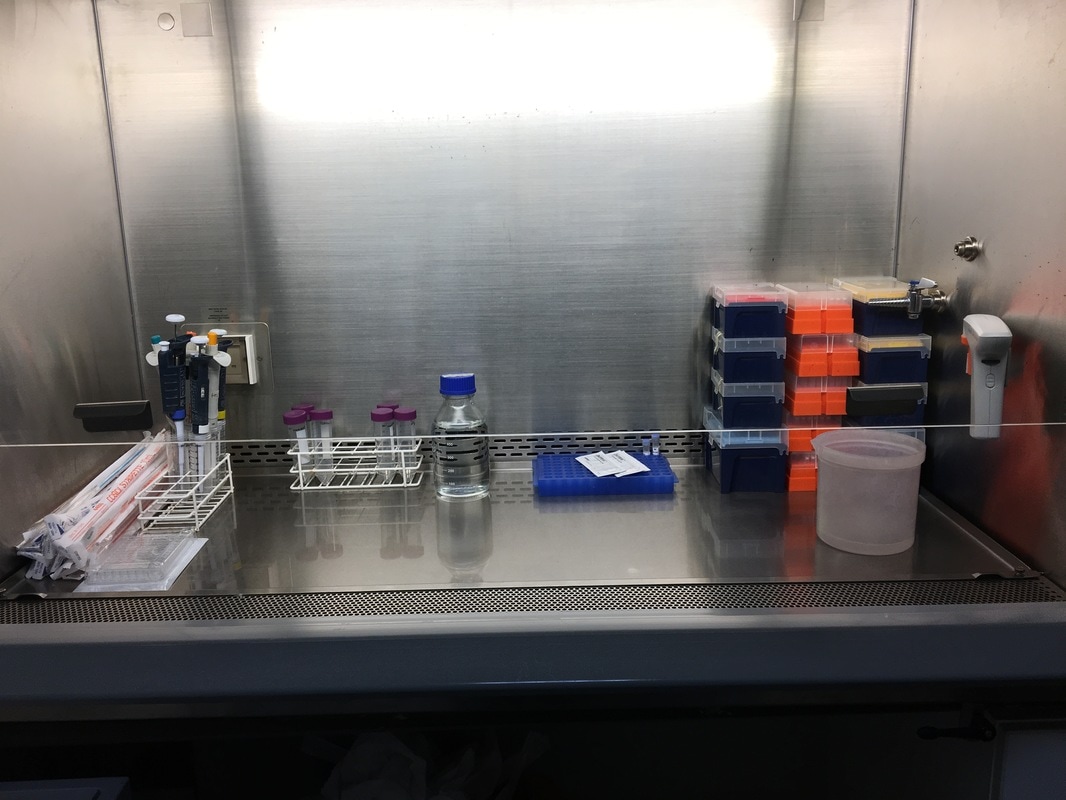
It is important before starting any experiment that you plan what you intend to do. This involves finding out about your experiment (what it is, why you do it, what it does). You then need to work out what reagents and equipment you'll use, how many cells you will need and the timings of plating, treating and completing the experiment. Part 1: Crystal Violet Cell Viability Assay Crystal violet is a common stain used to see the effects of treatments on cell viability (i.e how many cells does the treatment kill over a certain period of time). In 2D culture, cells that are alive tend to attach to the culture plate. When the cell dies it detaches from the plate and floats in the media. Crystal violet ONLY stains cells that are attached to a culture plate by dyes proteins and DNA within the attached cells. The amount of crystal violet can then be measured and this is used as an indirect way of quantifying cell death/viability. Part 2: Equipment and Reagents Buffers/Reagents:
Equipment:
Part 3: Number of Cells and Timing To determine how many cells you need for your experiment you need three pieces of information: (1) the doubling time of your cell line (i.e the time it takes for the amount of cells in your flask to double), (2) the time point you wish to investigate and (3) the size of your experimental plate. For this experiment:
NOTE: weebly doesn't allow me to superscript so whenever you see this "104" please note that is means "10 to the power of 4 or 40,000" I know that when my 96-well plate is full there is theoretically 4 x 10⁴ cells. You then use this as your final time point and half the number of cells until you reach your start time (see picture 1). As my cells aren't all doubling at exactly 24 hours, I reduce my end confluency a little to account for this. You can then work out how much media you need (each well takes 0.1ml) and how many cells you need (see picture 2). I will be doing two rows (12 wells in each row) for each cell line (see picture 3) and I will do two plates (I'm doing a similar but different experiment at the same time which I will explain later). So the total number of wells is 48, rounded up to 60 in case of error. Picture 3 shows the plate plan. Experiments are always run in triplicate (sometimes more). This is so we can average the results and reduce technical error (i.e. error by me). We will be treating our cells with increasing concentrations of our drug Metformin, shown on the plan.
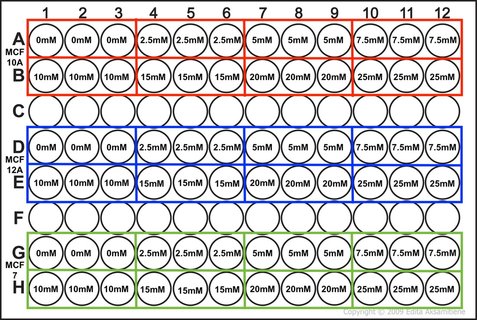
Picture 3: Plan of the 96-well plate we are conducting our experiment in. This plate plan is duplicated for the other experiment I'm running.
Part 4: Our hypothesis
It is important to have a hypothesis before we begin. This is a question we are asking which we hope our experiment will answer (either positively or negatively). Hypothesis: Metformin reduces cell viability of MCF10A, MCF12A and MCF7 cell lines. So that's it. Tomorrow we will set up our experiment and I will show you how we finish our calculation from picture 2. 
Colours adapted from http://ovarian.org.uk/
March is Ovarian cancer awareness Month.
Ovarian cancer is the 6th most common gynaecological malignancy in the UK. Over 7,000 cases are diagnosed yearly but only 35% of those women survive for 10 years or more. This is because ovarian cancer is usually diagnosed late, when patients are in stage III and IV of cancer. This makes treatment difficult, recurrence common and resistance to drugs frequent. There are four symptoms for ovarian cancer:
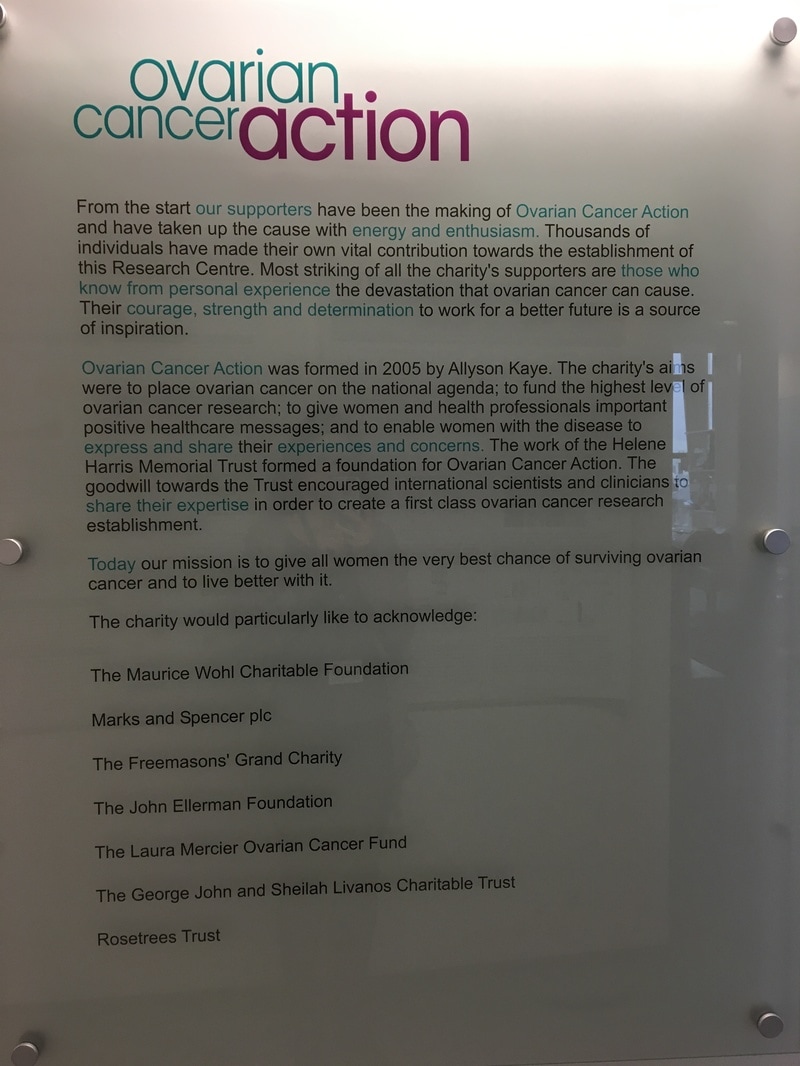
Experiencing these symptoms regularly over a prolonged period could be a sign of ovarian cancer. You may notice these symptoms are not very specific to ovarian cancer and typical "Oh it will clear up on it's own" symptoms people usually don't go to the doctor for. If you or someone you know experiences these symptoms you should chat to your doctor about them. You may feel a little foolish and it may be nothing but it's worth a little bit of piece of mind. The highest incidence of ovarian cancer is in older women (70+) but as we all know cancer can effect you regardless of age. Another indicator of ovarian cancer is CA-125. CA-125 is a protein coded by the gene MUC16. It is produced by epithelial cells in the female reproductive tract. In some ovarian cancers, CA-125 is over expressed and released into the blood. There it can be detected. high levels of CA-125 are associated with ovarian cancer diagnosis. This is known as a biomarker (i.e. a molecule that can be detected which indicates cancer). However this is not 100% cancer specific. Other disease in the ovaries/uterus can lead to the release of CA-125. Further diagnostic tests such as ultrasound and/or CT scan are needed. There is a heritable genetic element to ovarian cancer. Some of you might recognise BRCA as a key mutation in breast cancer (most notably Angelina Jolie had a prophylactic double mastectomy). BRCA mutations are also associated with increased ovarian cancer risk. It is important for BRCA carriers to not only be monitored for breast cancer but also ovarian cancer. Depending on your stage, the most common treatments for ovarian cancer are surgery and chemotherapy. Occasionally women will receive chemotherapy before surgery (known as neoadjuvant chemotherapy). Radiotherapy is also a treatment option. Unlike other cancers where there are more targeted therapies available (for example tamoxifen for ER+ breast cancer) to date the only targeted therapies for ovarian cancer are in clinical trial stages. This reduces the options for women who develop resistance to primary chemotherapy, such as platinum-based chemotherapeutics. There is a genetic element to ovarian cancer. Some of you might recognise BRCA as a key mutation in breast cancer (most notably Angelina Jolie had a prophylactic double mastectomy). BRCA mutations are also associated with increased ovarian cancer risk. Now for the positive! There are people (great, amazing and talented people) across the world currently working on ways to detect ovarian cancer sooner, treat ovarian cancer better and ultimately save women's lives. I personally know a lot of these people. I work on the same floor as the Ovarian Cancer Action Research Centre and am one of the very few who don't work on ovarian cancer on this floor (sorry). I can tell you from first hand experience, these people work their butts off and are incredibly passionate about beating ovarian cancer. If you trust anyone, I would trust these people because they to me are incredible and dedicated. Every year Ovarian Cancer Action hosts a "Walk in her Name" charity walk to raise vital funds for ovarian cancer research. This is where the money raised goes - to beating Ovarian Cancer.
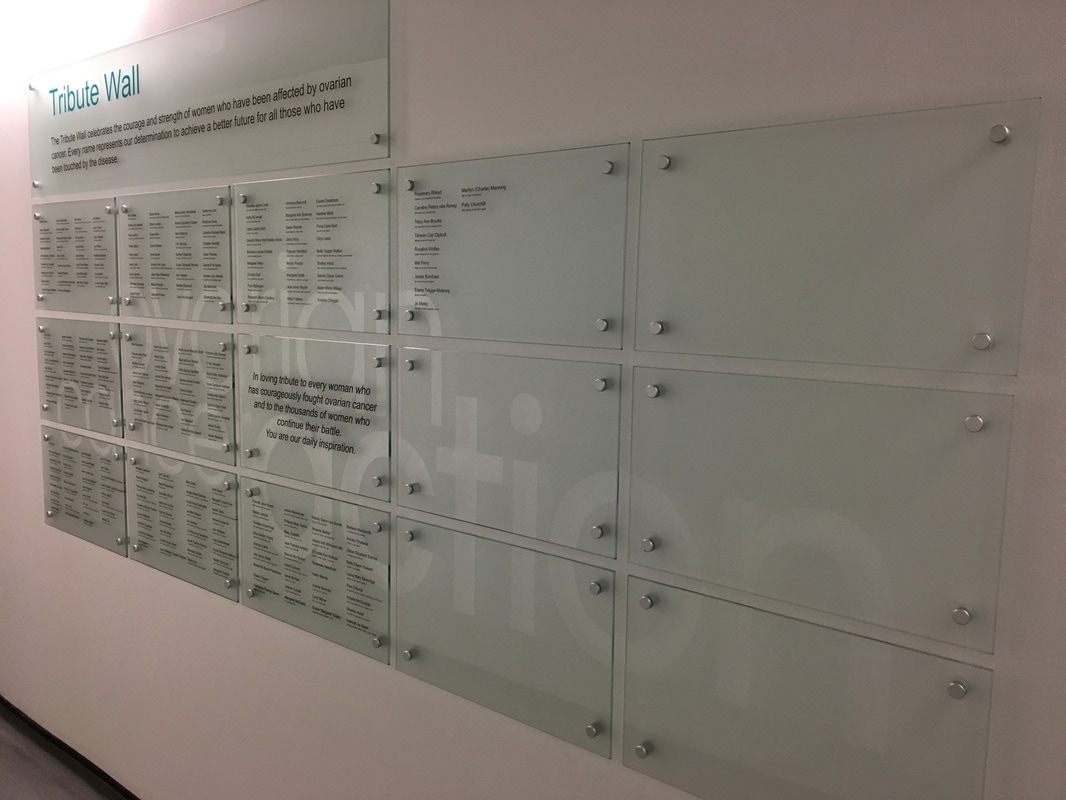
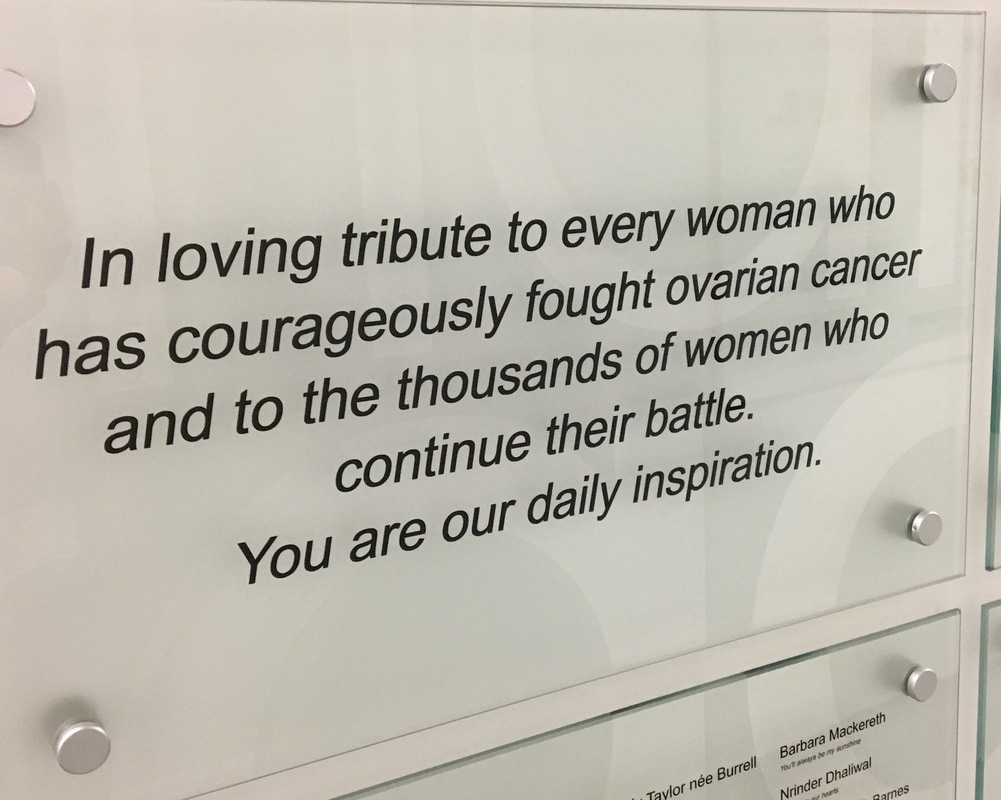
Ovarian Cancer Action tribute Wall. Each name is a woman who sadly lost her life to Ovarian Cancer. It is a constant reminder (just outside the labs) of what research means and who is it for.
If you want to know more about Ovarian Cancer Action follow them on twitter or check out their website:
https://twitter.com/OvarianCancerUK http://ovarian.org.uk/ If you want to take part in "Walk in Her Name" or donate: http://ovarian.org.uk/get-involved/ http://ovarian.org.uk/get-involved/fundraise/walk-in-her-name/ All Ovarian Cancer Statistics and information is from: http://www.cancerresearchuk.org/about-cancer/ovarian-cancer http://www.cancerresearchuk.org/health-professional/cancer-statistics/statistics-by-cancer-type/ovarian-cancer http://ovarian.org.uk/ |
AuthorMy name is Caitriona and I am a PhD student at Imperial College London, UK. Categories
All
|