|
It's the last and final day of our cell viability assay. Today we will measure how much crystal violet there is in each well and analyse our data.
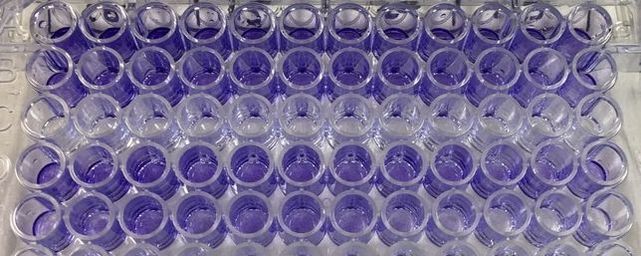
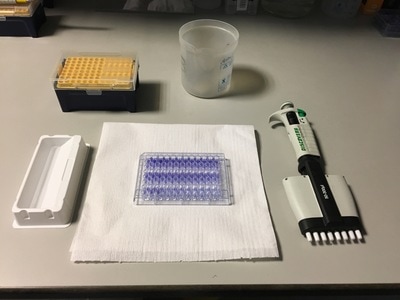
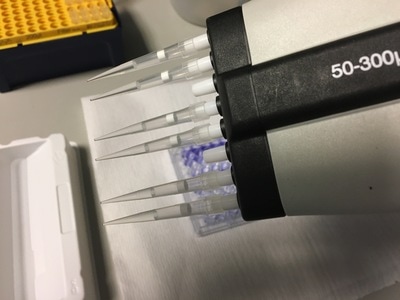
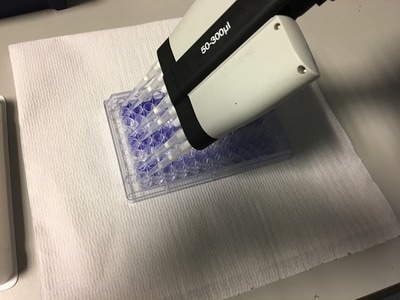
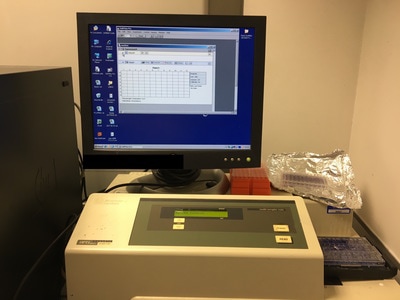
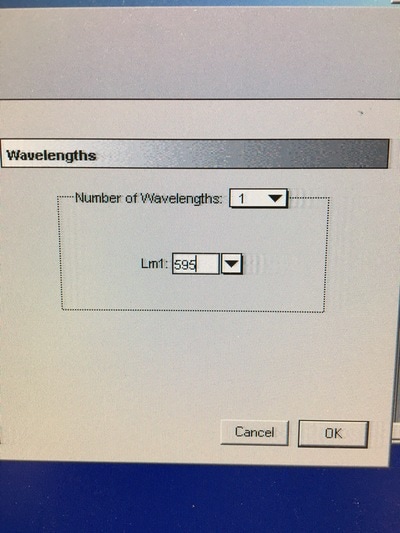
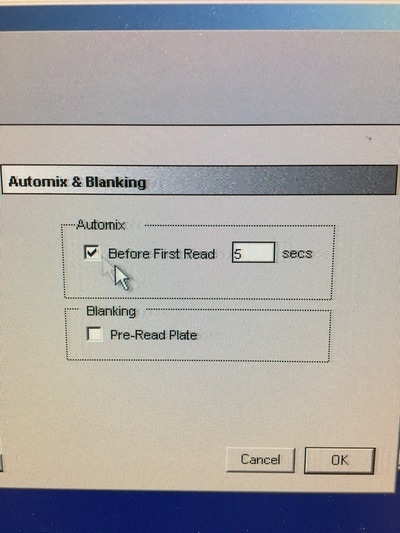
Part 1: Measuring Crystal Violet Absorbance To understand the next part I need to talk to you about absorbance. When light hits an object a certain amount of light bounces back which we see. For example white doesn't absorb light and bounces back almost all the light whereas black absorbs light and bounces back almost no light. The colours we see are different levels of light bouncing back from an object which is picked up by our eyes. Each colour has a different wavelength. The absorbance reader uses this principle. The reader (in picture 4) sends light into each well of the plate. It then measures how much light is absorbed. The higher the absorbance, the less light bounces back or the more light is absorbed by the object. We tell the machine what wavelength crystal violet is on, in this case it's 595nm. But the crystal violet we have is dried into the attached cells. We can't measure absorbance this way as the absorbance reader needs a liquid. So we dissolve the crystal violet in 10% acetic acid (which is essentially vinegar). The vinegar draws the crystal violet from the cells, allowing it to dissolve in the liquid. We add 80ul of 10% acetic acid to each well. This MUST be exact. The absorbance reader uses light absorbance and the volume of liquid to make its measurement. If the liquid is different in each well, the absorbance measurement will also be different. As shown in pictures 1-3, the 10% acetic acid is added to each well and placed on a rocker for at least 20 minutes. This aids in drawing out the crystal violet dye from the cells. We also add 80ul of 10% acetic acid to three wells with no cells in them. This is our blank. The plate itself and the acetic acid will have a small absorbance. We call this "background". We want to remove the background to make sure the data we use is completely from the the cells attached to the wells. We then place the plate into the absorbance reader machine and set the wavelength to 595nm. To make doubly sure that all the crystal violet is dissolved into the 10% acetic acid we set the machine to automix for 5 seconds before reading the plate. The machine essentially gently shakes the plate (picture 6).
Part 2: Analysing the Data
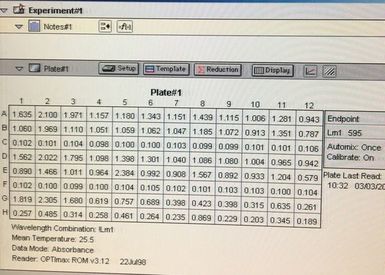
Once the machine has read the absorbance of the plate it gives you a read out (for example picture 7. I will point out this is an old picture and not our results).
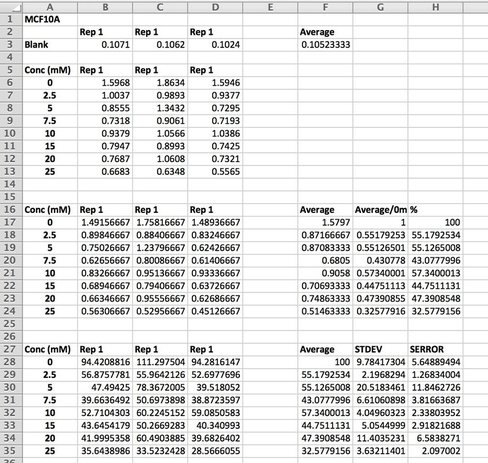
We can then export this to excel (picture 8). I have highlighted the wells for each cell line and also each dose. As you can see the white wells are the absorbance given by the plate. The first three wells on line 3 are our blanks.
We then want to analyse our data (picture 9).
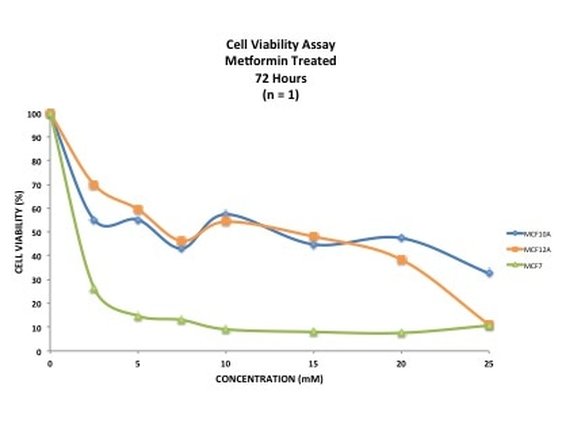
We take an average of our blank as well as our data. As I said in Day 1, we do everything in triplicate (called a biological triplicate). This allows us to average over the three wells and should even out discrepancies between wells. These discrepancies can be caused by technical error (e.g. treating or adding the 10% acetic acid) or by the equipment (e.g. the pipette etc.). Before we average our data, we take the average of the blank from each well (see B17 - D24). We then average our data and make this into a percentage. We then calculate the standard deviation and standard error. This tells us how close our triplicates are to each other. The higher the STDEV and SERROR, the more differences there are between triplicates. This give us our error bars. As we have only done one experiment, there are no error bars but once you do three or more and average across experiments you can then add the error bars. We then plot the results on a smooth scatter plot (picture 10).
Picture 10 finally shows the results of our experiment. As you can see, we have not gotten what we expect. A typical assay like this where we know the drug kills cells should have a smooth line which decreases or doesn't change as you move across doses. This is evident in MCF7 (green line) however it is not perfect, as it starts to increase at the highest dose. In our two non-cancerous cell lines MCF10A (blue) and MCF12A (orange), there is a lot of up and down. This shouldn't look like this. How I know is by looking at the triplicates for these two cell lines and the standard error. You can see that in some cases (picture 9), all the triplicates are similar however in others, there is one triplicate which is higher than the rest by a significant amount. For example in picture 9, row 20B, the second triplicate for 7.5mM is much higher than the other two. This will throw off the average, making it higher then it may actually be. The standard error is also very high in some concentrations, making me think that technical error is putting the results off.
There are a number of reasons why this could happen:
This demonstrates that 1) your experiment will always go wrong at least once, especially when you first do it and 2) how important it is to repeat your experiments at least three times (called a technical replicate). These results could be due to technical fault or they could be real. By running the experiment three (or sometimes more) times you eliminate one of those possibilities, leaving the other. Once we have our final data we can work out the IC50 - this is the concentration of drug needed to kill or reduce viability of 50% of the cells. It is a good indicator as to how much drug you want to use. If you want (like me) to induce an effect from drug treatment but not kill off all the cells then you use a concentration lower than the IC50. However if your aim is to decimate the cells then you would use concentrations above the IC50. Unfortunately the data is a bit haphazard to get an accurate IC50 from. And that's it. This experiment will need to be done a few more times to see if it's technical error or if the cells really do this. I will post up the results of those experiments when I have them and hopefully we shall see something interesting. I will also show you how to calculate an IC50. I really hope that you have enjoyed doing this experiment with me and now have a little bit of an idea about what goes into an experiment like this. If you have any questions or comments please don't hesitate to comment below or send me a message on the FAQ page.
0 Comments
Leave a Reply. |
AuthorMy name is Caitriona and I am a PhD student at Imperial College London, UK. Categories
All
|
